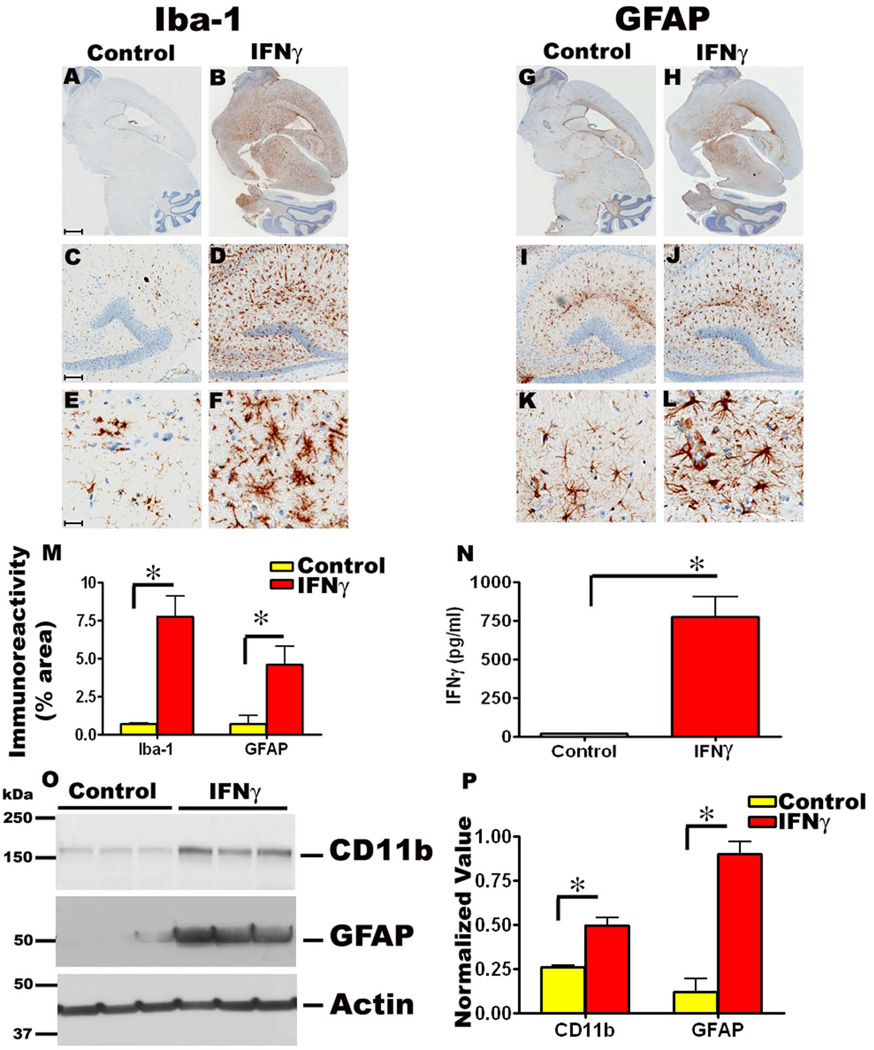
Fig 1. rAAV1-mIFNγ expression in TgCRND8 mice following neonatal intracerebroventricular injection results in extensive induction of microgliosis and astrogliosis.
A-F. rAAV1-mIFNγ or rAAV1-EGFP (Control mice) was injected into the cerebral ventricles of TgCRND8 mice on neonatal day P2 and sacrificed after 5 months (P2→5mo). Representative images of Iba-1 immunoreactivity in paraffin embedded whole brain sections (A, B) and higher magnifications of the hippocampus (lower panels, C-F) is shown. Abundant activated microglia displaying hypertrophic processes are present in mIFNγ expressing mice (B, D, F) compared to EGFP expressing control mice (A, C, E). Scale Bar, 600µm (A, B), 150µm (C, D) and 25µm (E, F). n=10/group.
G-L. Representative images of GFAP immunoreactivity in paraffin embedded sections of P2→5 month old TgCRND8 mice expressing mIFNγ or EGFP is depicted. Whole brain sections (G, H) along with higher magnification pictures (lower panels, I-L) showing detailed morphology of the activated astrocytes in and around the corresponding hippocampus are shown. Abundant astrocytes are evident in mIFNγ expressing mice (H, J, L) compared to EGFP expressing control mice (G, I, K). Scale Bar, 600µm (G, H), 150µm (I, J) and 25µm (K, L). n=10/group.
M. Quantitation of Iba-1 and GFAP immunoreactivity burden (% area) in paraffin embedded sections of P2→5 month old TgCRND8 mice expressing mIFNγ or EGFP as control. (n=5/group, *p<0.05).
N. Levels of mIFNγ were increased in mIFNγ expressing P2→5 month old TgCRND8 mice brains compared to age-matched controls. mIFNγ protein levels were analyzed using RIPA buffer solubilized brain lysates by sandwich ELISA. (n=5/group, *p<0.05).
O-P. Representative immunoblot showing increased levels of CD11b and GFAP levels in P2→5 month old mIFNγ expressing TgCRND8 mice compared to controls (O). β-Actin has been used as a loading control. Intensity analysis of CD11b and GFAP immunoreactive bands normalized to β actin is depicted (P). (n=3/group, *p<0.05).

