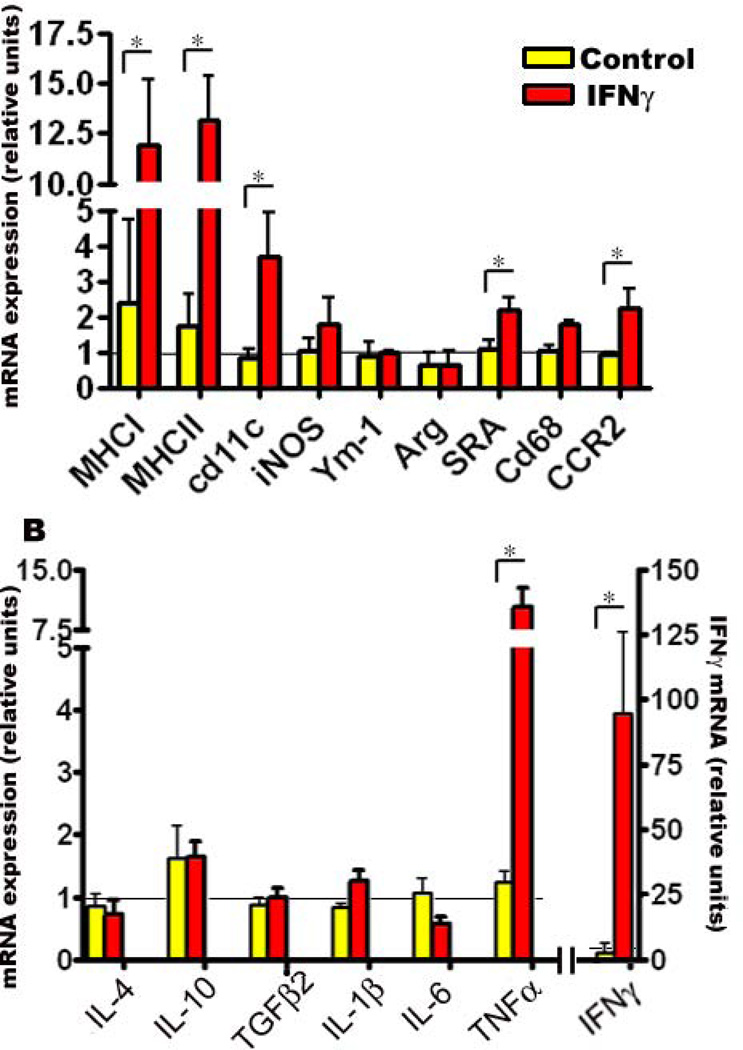
Fig 5. mIFNγ expression leads to alterations in glial activation markers and pro-inflammatory cytokines.
Expression of glial activation markers (A) and cytokines (B) were determined in P2→5 month old mIFNγ expressing TgCRND8 mice compared to EGFP expressing age-matched transgenic controls using real time Q-PCR. Relative quantitation of mRNA transcript levels was performed using the comparative cycle threshold method. The expression levels of different genes were normalized using β-actin levels from the corresponding samples. Data, expressed as relative units of mRNA expression, represents averaged fold change values obtained from mIFNγ expressing mice, relative to averaged values obtained from EGFP expressing mice. The horizontal line represents the reference point used for relative mRNA analysis. Error bars indicate SEM. (n=4/group, *p<0.05).

