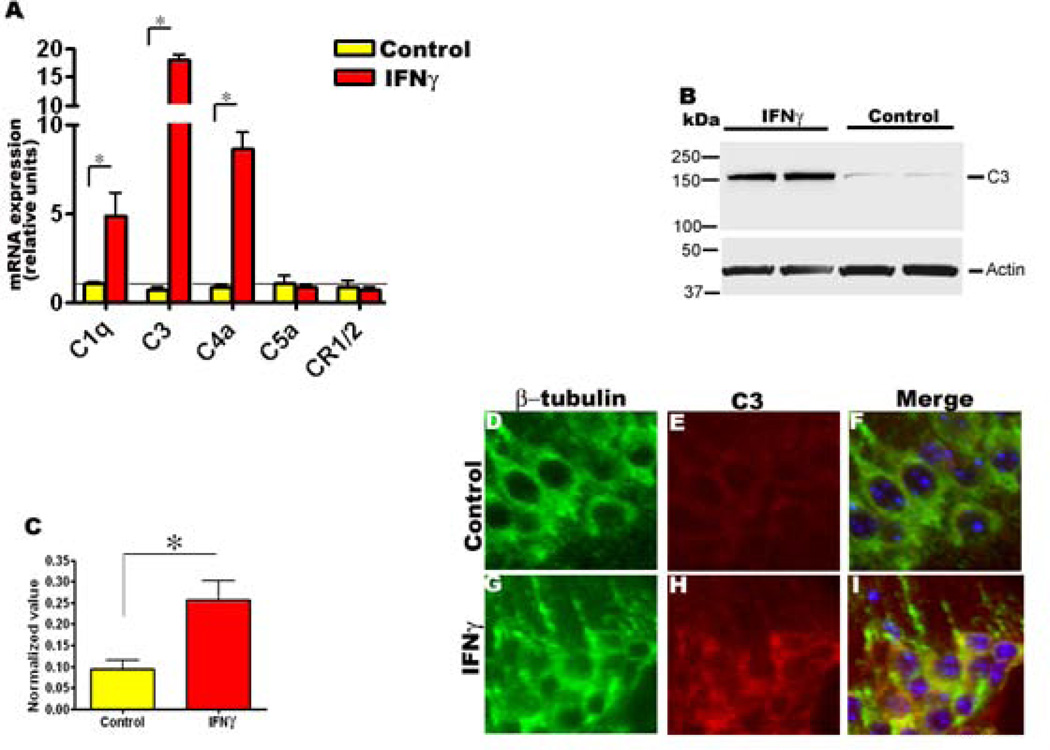
Fig 6. mIFNγ expression leads to increased levels of complement protein C3 in 5 month old TgCRND8 mice.
A. Increased mRNA transcript levels of complement protein C1q, C3, and C4a as determined by Q-PCR in P2→5 month old TgCRND8 mice expressing mIFNγ. Relative quantitation of mRNA expression was performed using the comparative cycle threshold method. The expression levels of different genes were normalized using β-actin levels from the corresponding samples. Data, expressed as relative units of mRNA expression, represents averaged fold change values obtained from mIFNγ expressing mice, relative to averaged values obtained from EGFP expressing mice. The horizontal line represents the reference point used for relative mRNA analysis. Error bars indicate SEM. (n=4/group, *p<0.05).
B-C. Representative immunoblot depicting complement C3 protein levels in P2→5 month old TgCRND8 mice expressing mIFNγ or EGFP (B). Quantitative analysis of anti C3 positive immunoreactive band normalized to β-actin shows significantly increased levels of C3 in P2→5 month TgCRND8 mice expressing mIFNγ compared to age-matched controls (C). (n=4/group, *p<0.05).
D-I. Representative images depicting anti-C3 immunofluorescence staining (red stain) colocalizing with β-tubulin immunoreactive neurons (green stain) in the hippocampus of mIFNγ expressing P2→5 month old TgCRND8 mice compared to controls. Blue represents the DAPI stained nuclei. (magnification, 600×). n=3/group.

