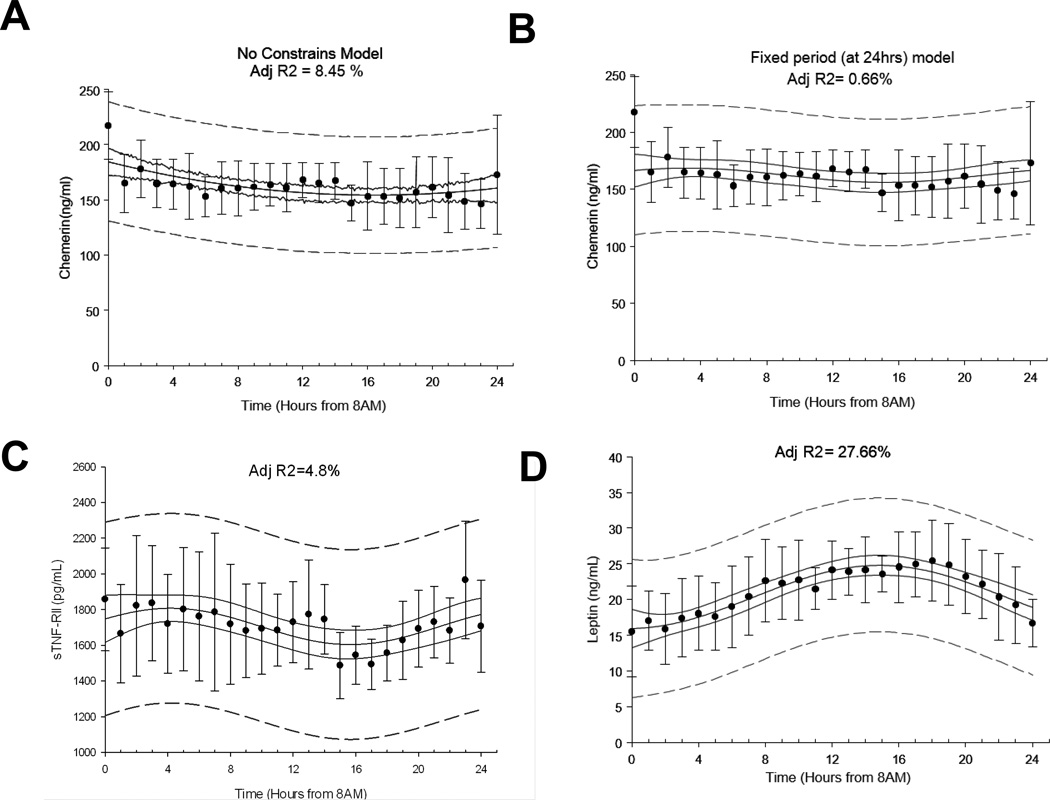
Figure 2. Day/Night Variation of Chemerin.
Average 24-hour (A) chemerin (ng/ml) with no constrains, (B) chemerin (ng/ml) with 24-hour fixed period, (C) sTNFRII (pg/ml) and (D) leptin (ng/ml) levels (non-linear adjusted R2 is displayed on top center of each panel). Error bars represent SD, continuous line represents 95% confidence band, and dashed line represents 95% prediction bands. Adj-R^2, Adjusted coefficient of determination.

