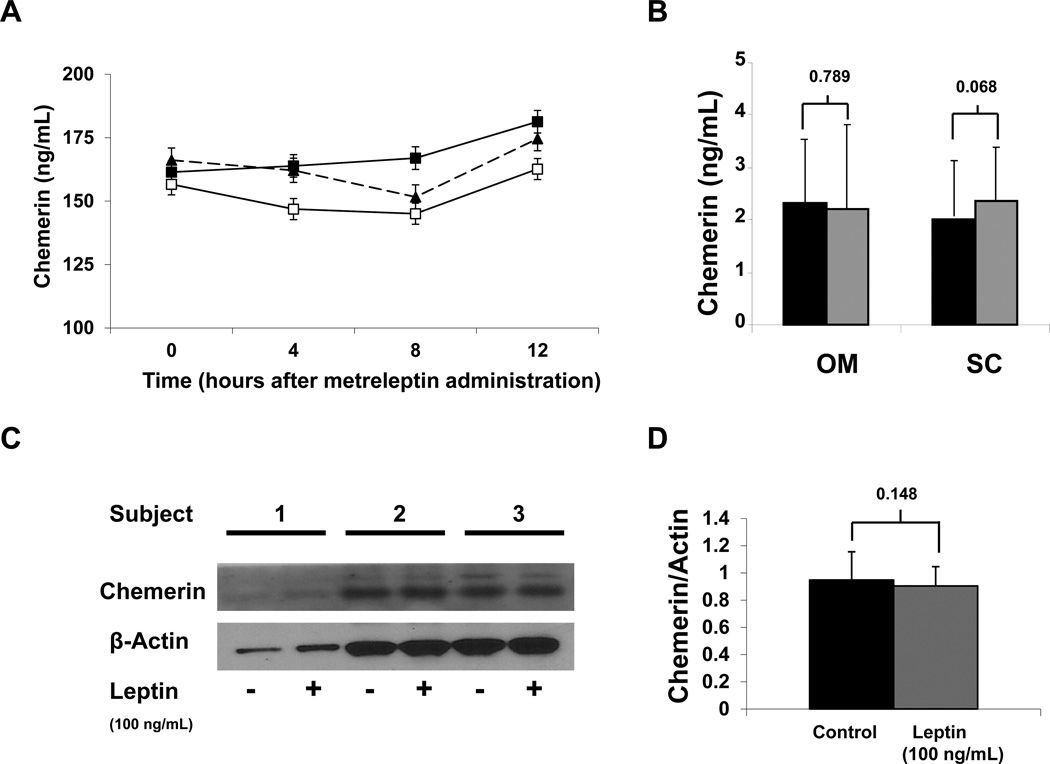
Figure 4. Leptin Effects on Chemerin.
Average 16-hour (A) chemerin (ng/mL) levels after treatment with three doses of leptin (0.01, 0.1, and 0.3 mg/Kg). Chemerin levels in supernatant (B) with ( ) or without (■)100 ng/mL leptin treatment for 20 hours in subcutaneous and omental adipose tissue. Chemerin protein expression (C – D) in subcutaneous adipose tissue after leptin treatment. (B–D) Results are the mean of 3 experiments. Data were analyzed by paired T-Test. Values are means +/− SD.

