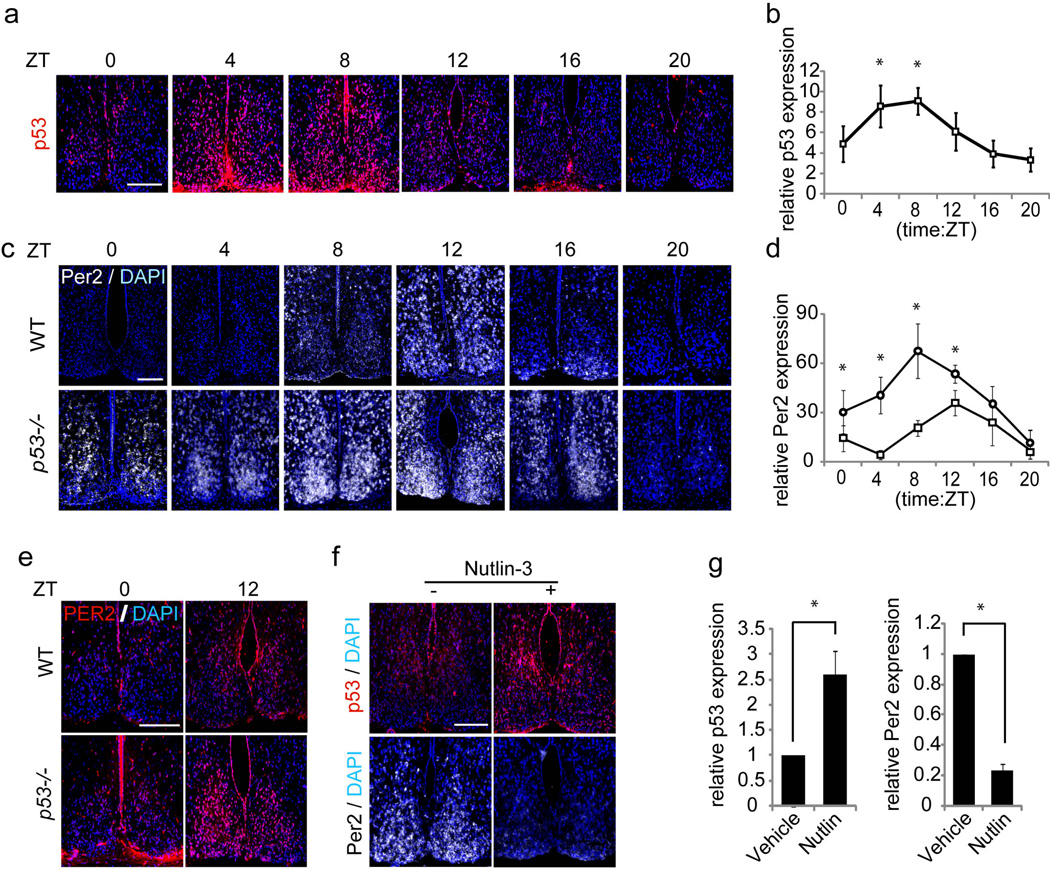
Figure 3. p53 oscillates and modulates Per2 expression in the SCN.
(a) Immunofluorescence analysis of p53 expression in WT mouse SCN. (b) Quantification of p53 expression in the SCN (n=3). ANOVA: p< 0.05. post hoc t-test: *p< 0.05. (c) In situ hybridization detection of Per2 mRNA in SCN of WT and p53−/− mice. (d) Quantification of Per2 expression in the WT (square) and p53−/− (circle) mouse SCN (n=3). ANOVA: p< 0.05. post hoc t-test: *p< 0.05. (e) Immunofluorescence analysis of PER2 expression in SCNs from WT or p53−/− mice (f) Correlation between p53 protein levels, shown by immunofluorescence, and Per2 expression, shown by in situ hybridization, in Nutlin-3 (200 mg/kg) or DMSO injected SCN. (g) Statistical analysis of (f) (n=2). Scale bars, 200 µm. Error bars: mean ± SEM. T-test:.*p< 0.05.

