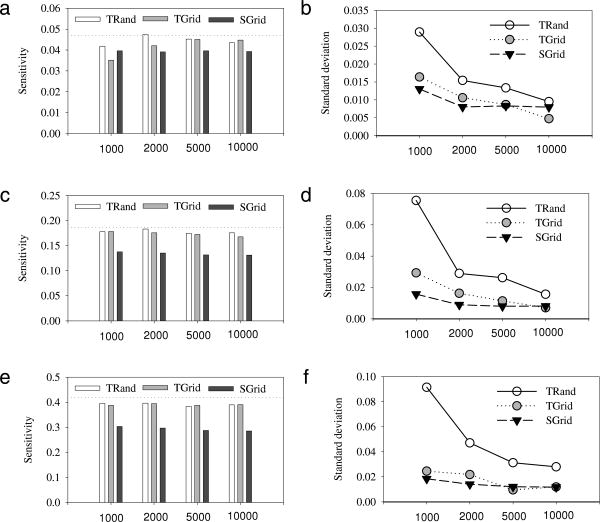
Fig. 1.
Comparison of different sampling approaches (SGrid = search-curve based sampling using the auxiliary variables s, TRand = simple random sampling in θ-space; TGrid = random balance design sampling in the θ-space) for the first-order sensitivity indices with different sample sizes (1000, 2000, 5000 and 10,000). The panels (a), (c) and (e) represent the sample mean (based on 20 replicates) of the first-order sensitivity indices for parameters x1, x2 and x3, respectively. The dotted horizontal reference lines represent the analytical sensitivity indices in Table 1. The panels (b), (d) and (f) represent the corresponding standard deviations for the estimated sensitivity indices.

