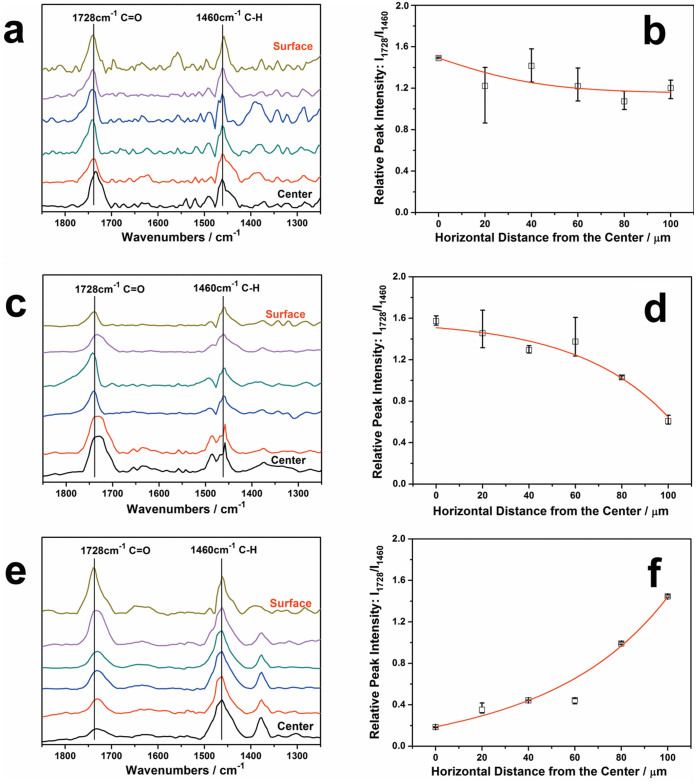
Figure 3.
a) Microscopic FT-IR spectra of the cross-section of a single yarn of the Cotton-g-PHMA with the testing step of 20 μm from the center; b) The relationship between the peaks' intensity of the ether group and the methylene group and the distance from the center in the yarn; c) Microscopic FT-IR spectra of the cross-section of a single yarn of the Cotton-g-PHMA after the abrasion test; d) The relationship between the peaks' intensity of the ether group and the methylene group and the distance from the center in the yarn; e) Microscopic FT-IR spectra of the cross-section of a single yarn of the Cotton-g-PHMA after abrasion test and then steam ironing; f) The relationship between the peaks' intensity of the ether group and the methylene group and the distance from the center of the yarn.

