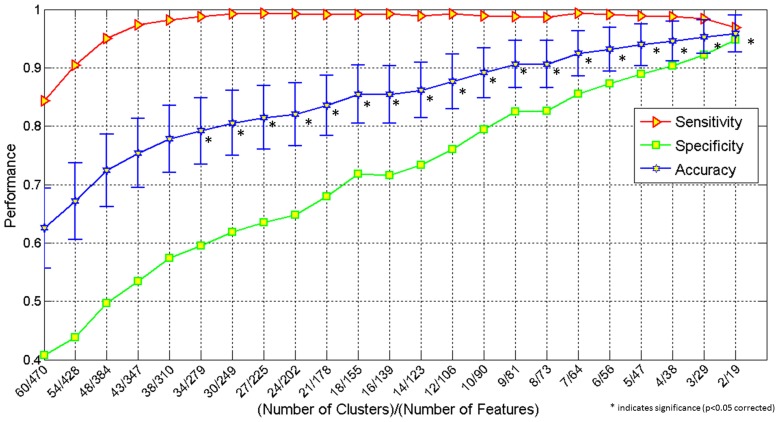
Figure 2.
Graph showing classification accuracy, sensitivity and specificity obtained by simultaneously using the following features: behavioral scores, functional connectivity, effective connectivity and fractional anisotropy obtained from DTI. The X-axis shows number of clusters/number of features and the Y-axis, the performance (classification accuracy, sensitivity and specificity). *indicates significance (p < 0.05 corrected).

