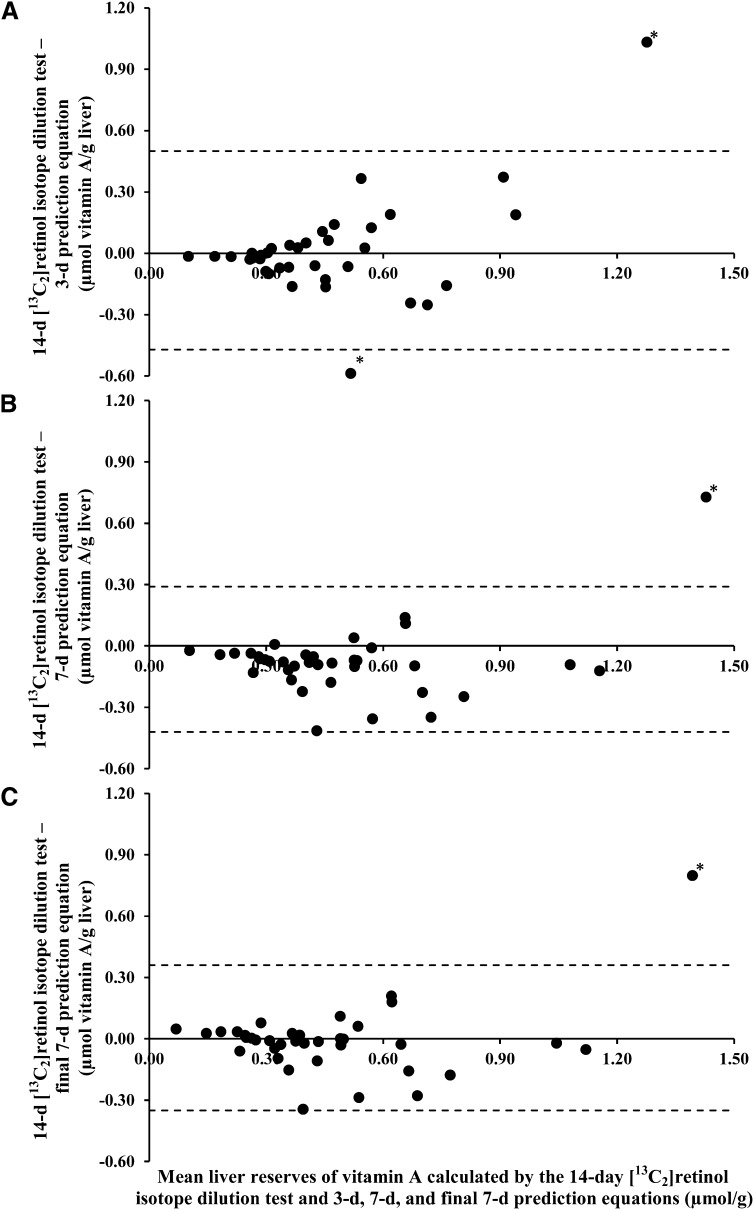
FIGURE 4.
Bland-Altman plots of the 14-d [13C2]retinol isotope dilution test results and 3-d (A), 7-d (B), and final 7-d (C) prediction equations in young adult women. Liver reserves were calculated once by using the 14-d [13C2]retinol isotope dilution test and the 3-d, 7-d, and final 7-d prediction equations, where estimated liver reserves = 3.5 × (3-d [13C2]retinol isotope dilution test value), 1.7 × (7-d [13C2]retinol isotope dilution test value), or 1.7 × (7-d [13C2]retinol isotope dilution test value) + 0.07, respectively. The difference and mean of the 14-d [13C2]retinol isotope dilution test and each prediction equation were calculated and plotted. Limits of agreement (mean difference ± 2 SDs) are shown by the dashed lines. Possible outliers are denoted with an asterisk. The 3-d prediction equation appears to have increasing variability from the 14-d [13C2]retinol isotope dilution test result as liver reserves increase. The 7-d prediction equation systematically overestimated liver reserves compared with the 14-d [13C2]retinol isotope dilution test by 0.07 μmol/g (t test, P = 0.026). The mean difference between the final 7-d prediction equation and the 14-d [13C2]retinol isotope dilution test result was not different from zero (t test, P = 0.96). n = 36, 38, and 38 for A, B, and C, respectively.

