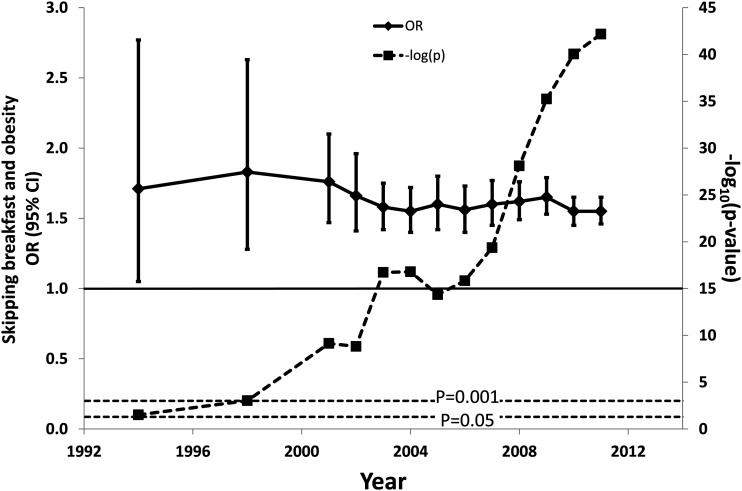
FIGURE 3.
Cumulative meta-analysis of studies analyzed in the meta-analysis. Each data point represents the synthesis of all studies included year on year (n = 58 studies with 88 independent groups). Diamonds represent the ORs of skipping breakfast and being overweight or obese bounded by a 95% CI. The black horizontal line is set at an OR of 1. The final OR is 1.55 (95% CI: 1.46, 1.65). Squares represent P values of ORs for each year of the analysis. Two horizontal dotted lines represent the traditional P = 0.05 significance and P = 0.001, which was suggested to represent strong evidence of an association (38). The final P value is 10−42.

