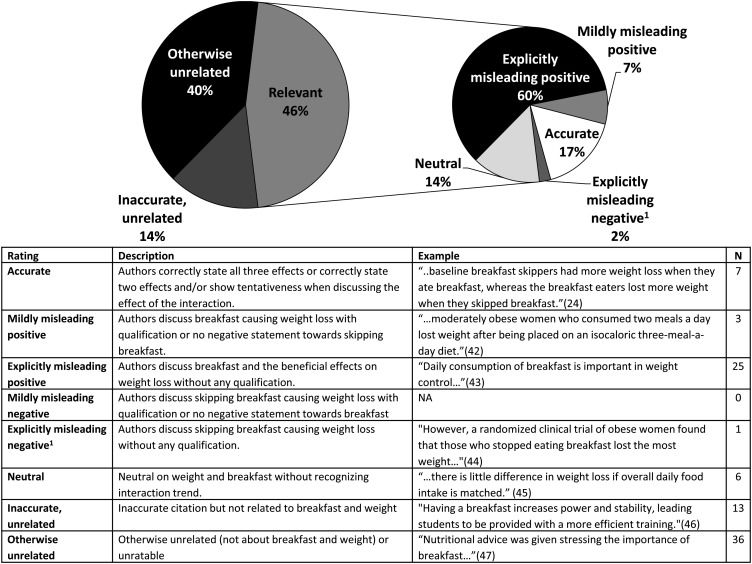
FIGURE 6.
Categorization of 91 articles that cited Schlundt et al (10). Articles that cited Schlundt et al (10) were categorized as shown in the table inset in the figure. All articles were included in the left pie chart, with only the relevant citations presented in the right pie chart (n = 42). 1The one study that was explicitly misleadingly negative also cited Schlundt et al (10) accurately elsewhere in the article.

