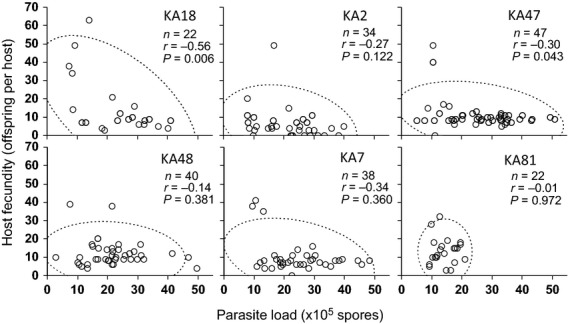
Figure 2.

The correlation between host fecundity and parasite load. Measured on day 40 post-infection for each host genotype and for all inoculation doses. Negative correlations indicate a loss of fecundity with increasing parasite load, whereas correlations not different from zero suggest that host genotypes tolerate increasing parasite loads without suffering a reduction in fecundity. Note that while we present the individual correlation coefficients, a complete analysis revealed no significant difference in the correlation between host genotypes (see text for details). Ellipses are 95% confidence intervals. r, Pearson’s correlation coefficient; n, sample size.
