Figure 3.

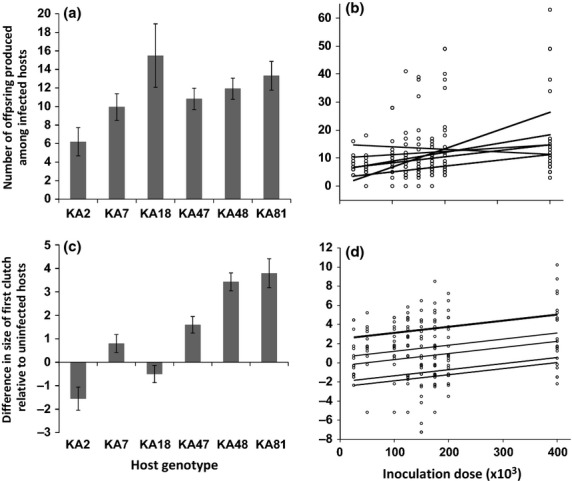
Fecundity compensation. (a) The mean number of offspring (± standard errors), across all inoculation doses, for each host genotype. (b) Least-squares regressions for the number of offspring per infected host, plotted against inoculation dose, for each host genotype, obtained from the best generalized linear model (F11,190 = 4.23, P < 0.0001, R2 = 0.20; see Table 1). (c) The mean level of fecundity compensation (± standard errors), measured as the difference in number of offspring of the first clutch had by infected individuals, relative to the first clutch of uninfected individuals of the same genotype. (d) Least-squares regressions for the level of fecundity compensation, plotted against inoculation dose, for each host genotype, obtained from the best generalized linear model (F6,195 = 922.07, P < 0.0001, R2 = 0.40; see Table 1).
