Figure 3.

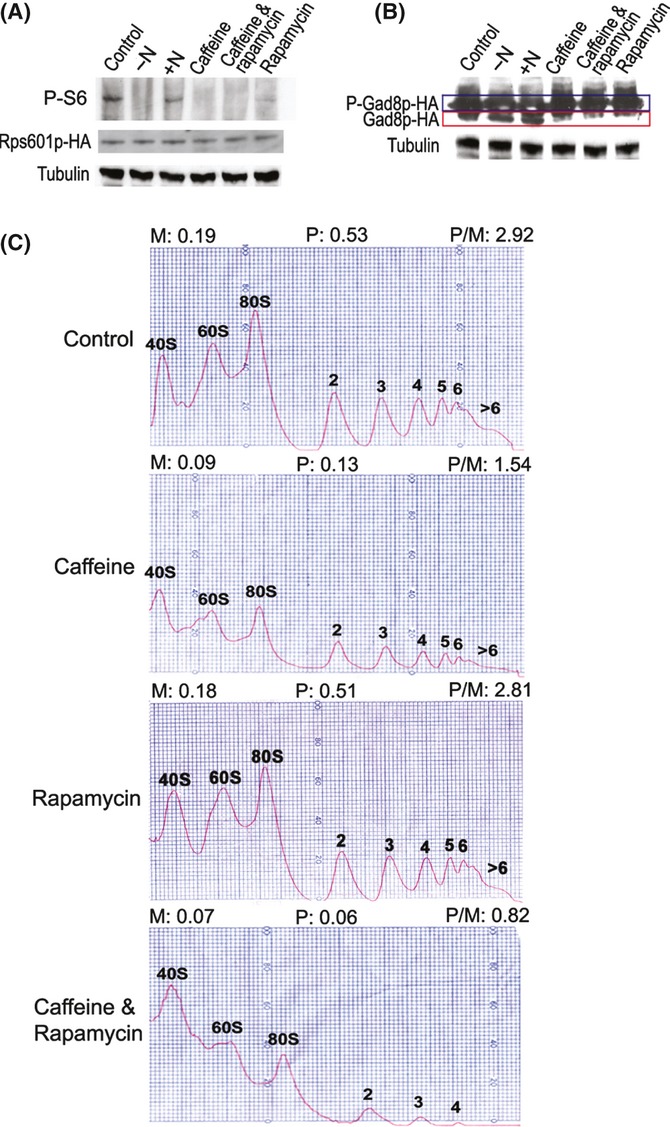
Effects of rapamycin and caffeine on TORC1-mediated translational control. (A) Western blot showing phosphorylation status of S6 proteins, using anti-PAS antibody, for cells grown in minimal medium supplemented with nitrogen (control), 1 h after removing nitrogen (−N), 30 min following nitrogen refeeding (+N), or with different drug treatments as indicated. Rps601p-HA and α-tubulin were used as loading controls. Caffeine and rapamycin are used at concentrations of 10 mm and 100 μg mL−1, respectively. (B) Western blot showing phosphorylation status of Gad8p-HA, with conditions as in (A). Phosphorylated and nonphosphorylated Gad8p are highlighted in blue and red boxes, respectively. (C) Polysome profiles from cells treated for 30 min in the absence (control) or presence of different drugs as indicated at left. Monosomal (M) and polysomal (P) peak areas as well as polysome-to-monosome ratios (P/M) are indicated on top for each condition.
