Figure 1.

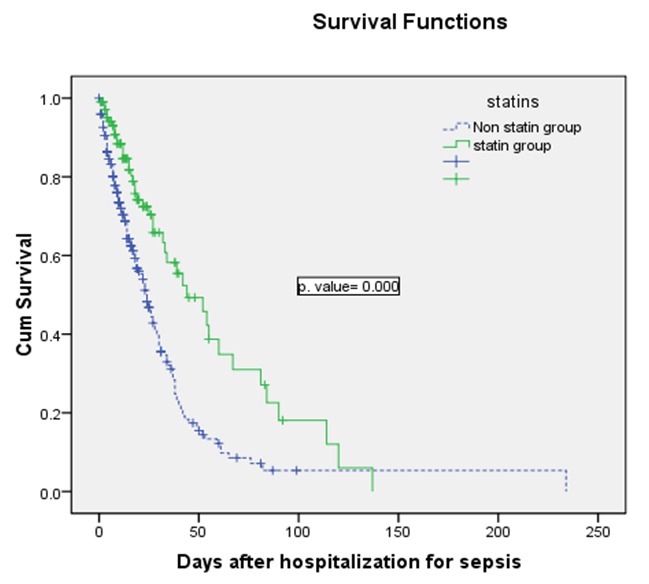
Figure 1. Kaplan-Meier curves showing the percentage of patients surviving in the statin group (solid line) and the control group (Dashed line).

Figure 1. Kaplan-Meier curves showing the percentage of patients surviving in the statin group (solid line) and the control group (Dashed line).