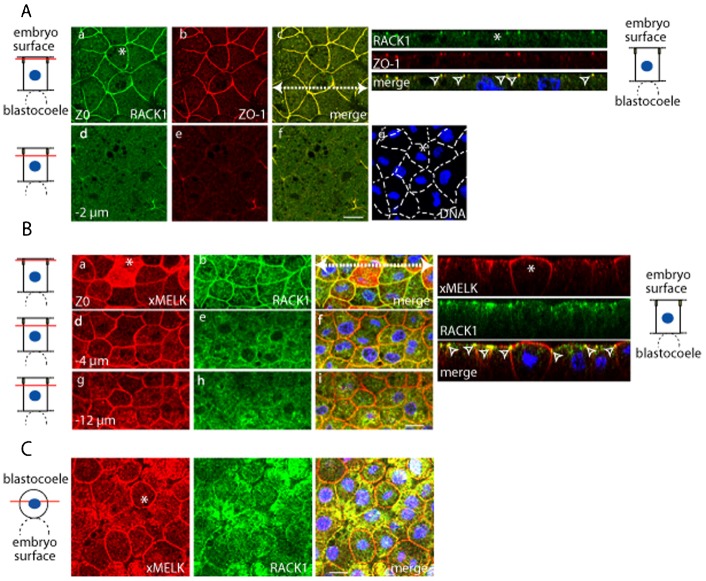
Fig. 7. In epithelial cells, RACK1 co-localizes with xMELK at the tight junctions.
(A) In gastrula epithelial cells, RACK1 co-localizes with ZO-1 at the tight junctions. Endogenous RACK1 (green, a,d) and ZO-1 (red, b,e) were detected with specific antibodies. Two single optical sections spaced by 2 µm are shown; their positions relative to the embryo surface are symbolized by red lines (diagrams on the left). Yellow rectangles symbolize tight junctions. Images were merged to visualize co-localization of RACK1 with ZO-1 (merge, c,f). DNA is blue (g). Asterisks indicate cytokinetic cell. White dashed arrow in panel c indicates the plane used for orthogonal projection of confocal planes shown on the right. Arrowheads point to the RACK1 which co-localizes with ZO-1 at the tight junctions. (B) RACK1 colocalizes with xMELK at the tight junctions. In epithelial cells, xMELK (green, a,d,g) and RACK1 (red, b,e,h) detected by specific antibodies co-localize at the tight junctions. Diagrams on the left: confocal planes relative to embryo surface are marked by red lines. Yellow rectangles symbolize tight junctions. The asterisk indicates cytokinetic cell. Orthogonal projections of confocal planes are shown on the right. The plane of orthogonal projection is indicated by a white dashed line in panel c. Arrowheads point to the RACK1 which co-localizes with xMELK at the tight junctions. (C) xMELK (red) and RACK1 (green) were detected by indirect immunofluorescence with specific antibodies in mesenchymal-like cells. Confocal plane relative to the blastocoel is indicated by a red line on the diagram on the left. Asterisk indicates cytokinetic cell. Images were merged together with images of DNA (blue) at the same confocal planes to visualize co-localization of xMELK with RACK1 (merge). Scale bars: 20 µm.

