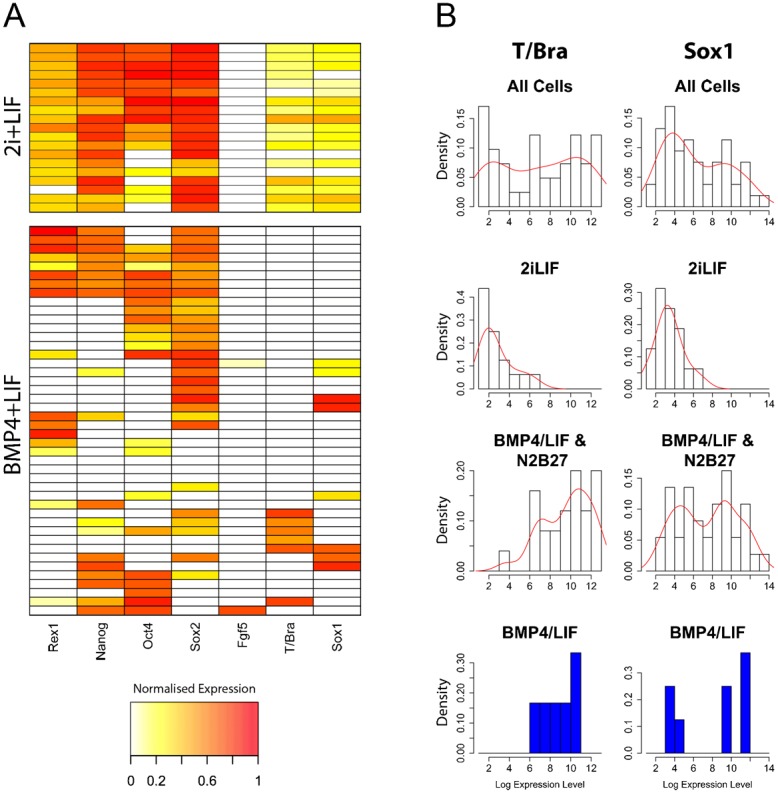
Fig. 1. Gene expression in individual wild-type (E14Tg2A) pluripotent mES cells in N2B27 supplemented with BMP4+LIF or 2i+LIF.

(A) Heat maps of pluripotency (Rex1, Nanog, Oct4 and Sox2) and differentiation (Fgf5, T/Bra and Sox1) marker gene expression in mES cells maintained in 2i+LIF or BMP4+LIF. Plotted values are natural logarithms of Gapdh-normalised expression levels, scaled such that cells with no expression of a particular gene have a value of 0 whilst cells that express the maximum detected level of a gene have a value of 1. (B) Histograms of primitive streak (T/Bra) and neural (Sox1) marker gene expression in different groups of mES cells. Natural logarithms of Gapdh-normalised expression levels are plotted as histograms (black outlined bars) with the corresponding probability density functions overlaid (red lines). The top row of histograms show data for all cells cultured in 2i+LIF, BMP4+LIF and after one to four days BMP4+LIF withdrawal (see Materials and Methods), whilst the lower three rows show data for subsets of the above. Only cells with detectable expression of the gene in question are included. The histograms show bimodal expression level distributions for both Sox1 and T/Bra, suggesting there are discrete groups of cells expressing high or low levels of these genes. These differentiation markers are only ever expressed at low levels by cells cultured in 2i+LIF, and are often coexpressed in individual cells (Fig. 1A). Conversely, in BMP4+LIF and after BMP4+LIF withdrawal (N2B27), these genes can be expressed at high or low levels, but tend not to be coexpressed (Fig. 1A). These observations suggest that cells expressing high levels of these genes are differentiating, whilst low-level expression of these genes is not indicative of commitment to a particular lineage. The fact that some cells in BMP4+LIF express high levels of Sox1 or T/Bra suggests these populations contain a proportion of differentiating cells.
