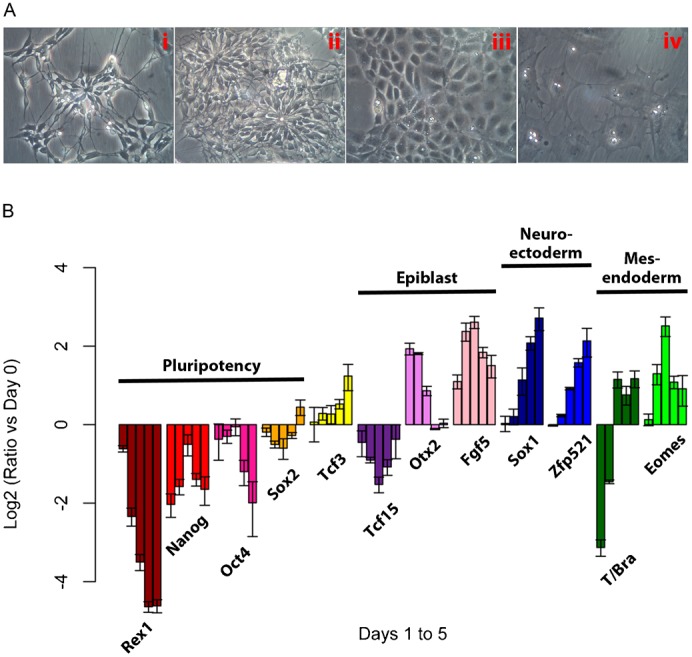
Fig. 2. Changes in morphology and gene expression as mES cells are differentiated over five days in N2B27 medium following BMP4+LIF withdrawal (see Materials and Methods).

(A) Examples of cellular morphologies observed after five days in N2B27: neural rosettes (i,ii), epithelial (iii) and mesenchymal (iv). (B) Population level changes in gene expression over the course of five days of differentiation. Expression of markers of pluripotency (Rex1, Nanog, Oct4 and Sox2), epiblast (Tcf15, Otx2 and Fgf5), neuroectoderm (Sox1 and Zfp521) and mesendoderm (T/Bra and Eomes) was measured. For each gene on each of the days from day 1 (left most bar) to day 5 (right most bar), the value plotted is the log2 of the ratio on that day compared to the level in BMP4+LIF (both values normalised to the levels of the gene Ppia). Error bars above and below each bar represent the standard deviation of the mean of 3 or more qPCR replicates.
