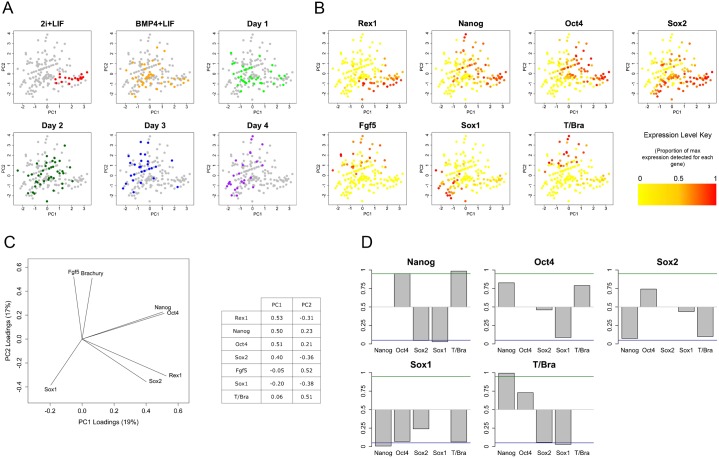
Fig. 3. Relationships between the expression levels of markers of pluripotency and lineage commitment in mES cells exiting pluripotency.
The expression of markers of pluripotency (Rex1, Nanog, Oct4 and Sox2) and lineage commitment (Fgf5, Sox1 and T/Bra) was measured in mES cells maintained in 2i+LIF, BMP4+LIF or differentiated over four days in N2B27 following withdrawal of BMP4 and LIF. Natural logarithms of Gapdh-normalised expression levels were used for all calculations relating to this figure and for plotting. (A,B,C) Principal Components Analysis (PCA) of gene expression in individual mES cells. Each point in the plots in panels A and B represents a single cell, the position of which is a function of the expression of seven genes (C) in that cell. The positions of individual cells are identical in each of the plots shown. The cells analysed here, with the exception of those cultured in 2i+LIF, were taken from the same population as those used to produce the population level gene expression data in Fig. 2. Individual cells are coloured according to treatment/differentiation day (A) or their expression of a particular gene (B). In panel B the natural logarithms of the Gapdh-normalised expression levels (including cells in which expression was not detected) are scaled such that they range between 0 and 1. Colours are then mapped to these values as shown by the colour key. The principal component loading values used to calculate the positions of individual cells and the percentage of the variability in the dataset that is explained by each axis are shown in panel C. (D) Relationships between the expression of pluripotency and differentiation genes after three to four days differentiation in N2B27. Cells were segregated (in silico) according to whether or not they express a first gene (plot titles). The mean level of a second gene (horizontal labels below each bar) in cells that express the first gene was then calculated. Bootstrapping was used to determine the probability that the mean level of the second gene was higher in cells that express the first gene than would be expected by chance (P value). These P values were plotted as grey bars. Bootstrapping involves shuffling the levels of the second gene across the population and repeating the calculation described above 100,000 times; the P value is the proportion of the bootstrap means that are lower than the real mean. A high P value indicates that the levels of two genes are positively correlated, whilst a low P values indicates they are negatively correlated. The green and blue lines at P values of 0.95 and 0.05 denote statistically significant relationships.

