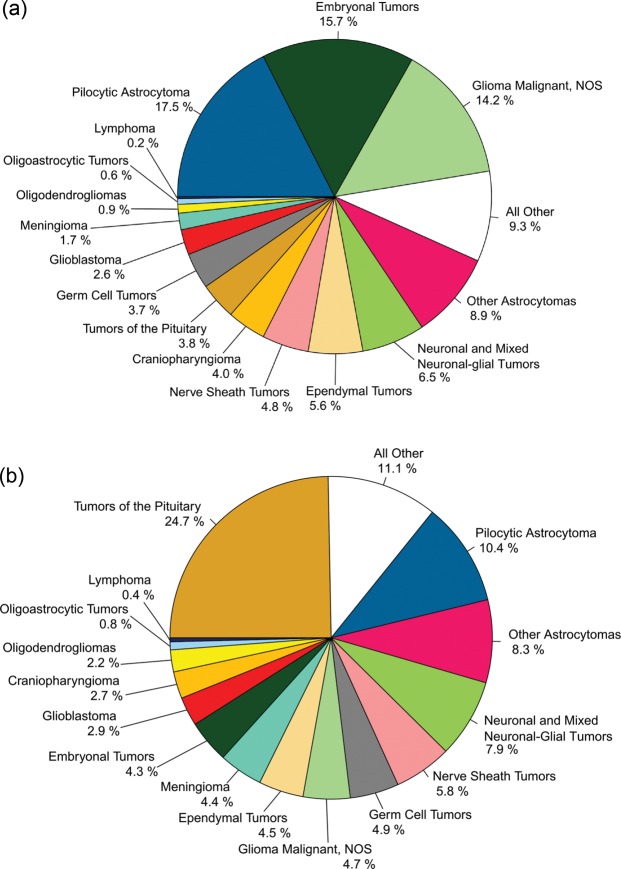
Fig. 15.
(a) Distribution of Childhood Primary Brain and CNS Tumors by Histology and Age (Ages 0-14) (N = 15,398), CBTRUS Statistical Report: NPCR and SEER, 2006-2010. (b) Distribution of Childhood Primary Brain and CNS Tumors by Histology and Age (Ages 15-19) (N = 6,114), CBTRUS Statistical Report: NPCR and SEER, 2006-2010

