Figure 2.
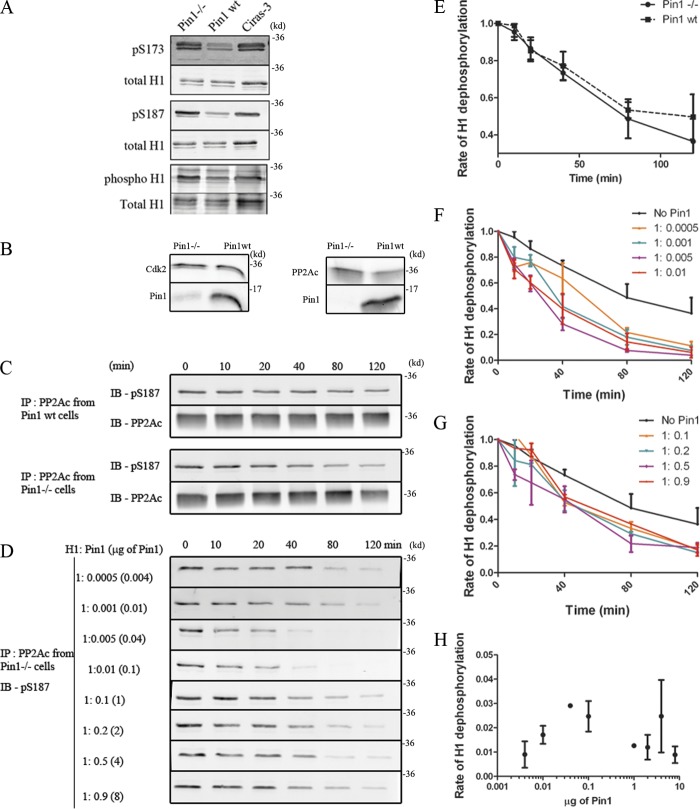
Pin1 promotes H1 dephosphorylation. (A) Histones were extracted from Pin1−/−, Pin1wt, and Ciras-3 cells, and were then probed with either pS173(H1.2/H1.5), pS187(H1.4), a phospho-specific stain that labels all phosphorylated proteins, or with a stain that labels total protein. Levels of pS173, pS187, and net H1 phosphorylation levels were found to be higher in Pin1−/− cells as compared with Pin1wt cells, similar to those observed in Ciras-3 cells (positive control). (B) Nuclear extracts from Pin1−/− cells and Pin1wt cells revealed that the levels of Cdk2 and PP2Ac were similar in both cells. (C) The dephosphorylation activity of PP2Ac activity was analyzed using purified H1 as a substrate. PP2Ac was immunoprecipitated from either Pin1wt cells or Pin1−/− cells and assessed for its ability to dephosphorylate pS187. The kinetics of this dephosphorylation reaction are plotted in E with each dot/square representing the average H1 phosphorylation level obtained from at least three independent experiments. The average intensity from the zero-minute time point is set as the maximum, against which all other time points are compared. (D) PP2Ac was immunoprecipitated from Pin1−/− cells and was mixed with a constant amount of H1, while levels of purified Pin1 were varied from 0.004 to 8 µg. The former corresponds to a molar stoichiometry of H1/Pin1 = 1:0.0005, whereas the latter corresponds to H1/Pin1 = 1:0.9. The kinetics of dephosphorylation is plotted in F and G, with the average intensity at the zero-minute time point set to 1. These curves were then submitted to a one-phase decay curve analysis and the rate obtained was plotted as a function of the amount of Pin1 added to the reaction (H).

