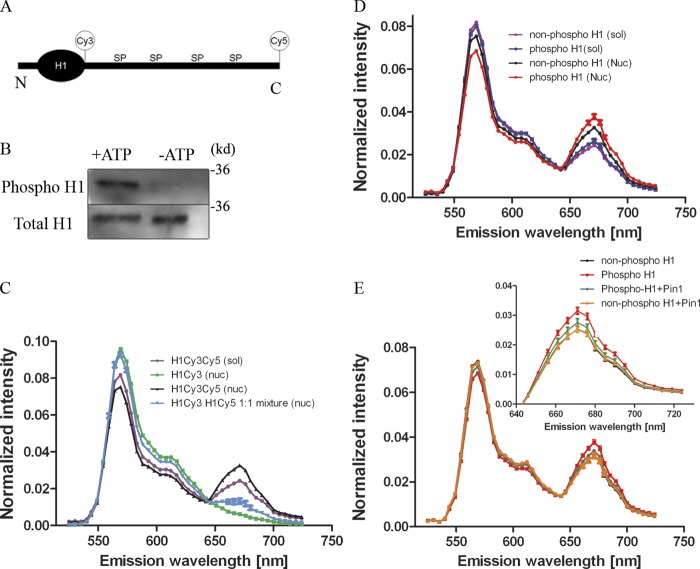
Figure 3.
Pin1 and H1 phosphorylation change the structure of the CTD. (A) The position of the Cy3 and Cy5 label are indicated in relation to the whole H1 molecule, not to scale (N, N-terminal; C, C-terminal; SP, Ser-Pro). (B) H1 labeled with Cy3 and Cy5 were treated with Cdk2 immunoprecipitated from Pin1−/− cells in the presence or absence of ATP and probed with a phospho-specific stain. These blots reveal successful phosphorylation of H1 in the presence of ATP (now referred to as phosphoH1), whereas Cdk2 was unable to phosphorylate labeled H1 molecules in the absence of ATP (now referred to as nonphospho H1). (C) Labeled phospho H1 molecules were then diluted either in solution (sol) or with reconstituted nucleosomes (nuc). A 514-nm laser was then used to excite the molecules and fluorescence emission spectra was obtained from 525–724nm (5-nm slit width). Fluorescence intensity was normalized to the total fluorescence intensity obtained from each spectrum. The spectra show a slight increase in FRET signal (peak at 671 nm) in the mono-labeled H1s (either Cy3 or Cy5) mixed with each other in 1:1 stoichiometry together with nucleosomes, indicating inter-molecular FRET, whereas this signal increases dramatically when both Cy3 and Cy5 are on the same H1 molecule. (D) FRET signal was compared between phosphorylated H1 and nonphosphorylated H1 in solution versus these molecules added to reconstituted nucleosomes. Although FRET signal remains the same when H1 is in solution, FRET signal is dependent on the phosphorylation status of H1 in the presence of reconstituted nucleosomes. (E) FRET signal was compared between phosphorylated H1 and nonphosphorylated H1 with reconstituted nucleosomes in the presence or absence of Pin1. Although phosphorylation alone increases the FRET signal, addition of Pin1 reduces this signal toward that of the nonphosphorylated H1 molecules.

