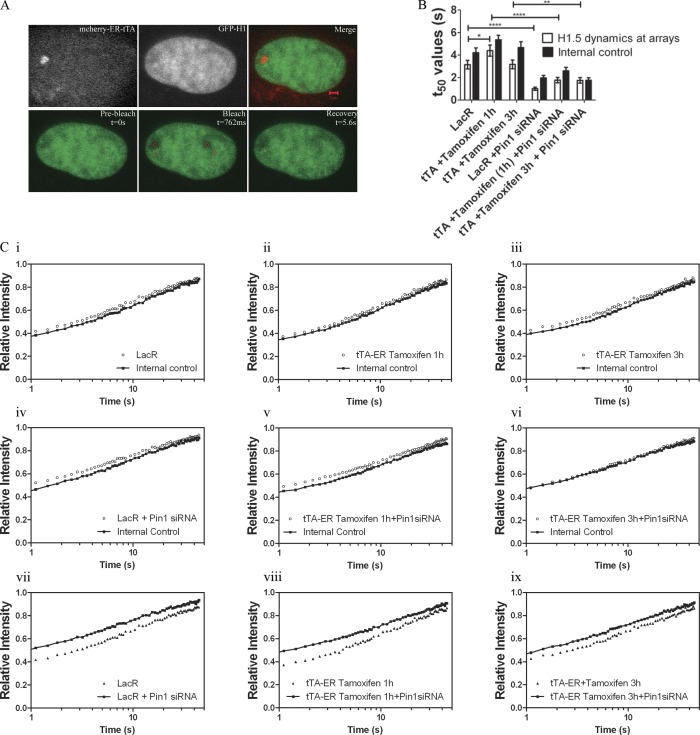
Figure 7.
Pin1 stabilizes H1 binding at sites of transcription. (A) GFP-H1.5 was cotransfected with either mCherry LacR or mCherry-ER-tTA in U2OS 263 cells harboring the arrays. H1 dynamics were monitored using FRAP with two separate regions in the nucleus being photo-bleached. One bleached region corresponded to either the mCherry LacR (transcriptionally inactive site) or mCherry-ER-tTA (transcriptionally active site), and photo-bleached region 2 corresponded to a random site within the nucleus in the same horizontal plane. (B) T50 values of the FRAP curves (C) show that H1.5 dynamics at the lac arrays is fairly similar to those of internal controls, in the transcriptionally uninduced state (Ci). The same trend is seen even when transcription is stimulated by transfection of mCherry-ER-tTA and tamoxifen is added for either 1 h (Cii) or 3 h (Ciii). Similar experiments were performed in cells treated with Pin1siRNA (Civ–Cvi). Major differences in H1 mobility can be observed when comparing the recovery rate in Pin1-proficient cells vs. those seen in Pin1-deficient cells (Cvii–ix). The increase in H1.5 dynamics upon Pin1 depletion is independent of transcriptional activity. Significance between control vs. Pin1siRNA treated t50 values was analyzed using unpaired t test (95% confidence interval). Notation for significance: *** if P value is < 0.001; ** if P is between 0.001 and 0.01; * if P is between 0.01 and 0.05. Each FRAP curve represents an average of ∼30 unique sites of transcription from three independent experiments.

