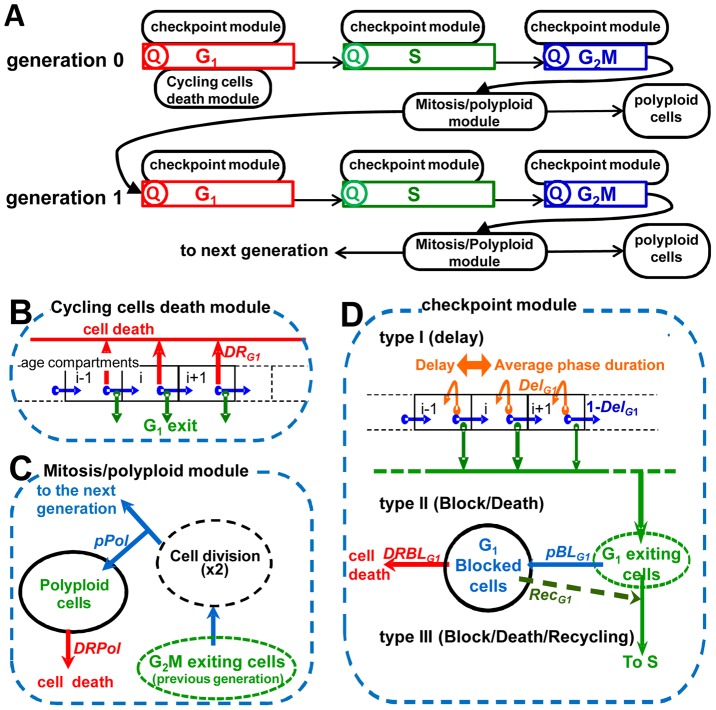
Figure 3. Structure of the modelling framework, with detail of cell progression and perturbation modules.
(A) The model reproduces the flow of cell cohorts through the cell cycle phases and subsequent generations, each phase including specific quiescence (Q) and perturbation modules. A cohort of cells entering a phase is first processed by the quiescence module, committing a fraction of them to the G1 quiescence compartment. Then untreated cells progress through the subsequent age compartments of each phase, exiting at different ages as shown in Figure S4 and detailed in supplementary Text S3. In treated samples this process is altered by perturbation modules, which can be applied to any phase, providing a flexible framework to build proliferation models with the desired complexity. (B) Cycling cell death module, exemplified for G1 phase. It applies first-order death kinetics to all cycling cells in phase G1 with a rate DRG1. (C) The mitosis/polyploid module acts on dividing cells, doubling the number of cells exiting G2M and assuming that a fraction (pPol) of newborn siblings re-fuse, collecting re-fused (polyploid) cells in a separate compartment, from which they die with a rate DRPol. (D) Checkpoint modules, exemplified for G1 phase. A specific type of checkpoint module can be selected, as described in Computational Methods, with parameters DelG1 (producing a transit delay), pBLG1 (block probability), DRBLG1 (death rate of blocked cells), RecG1 (recycling rate of blocked cells).

