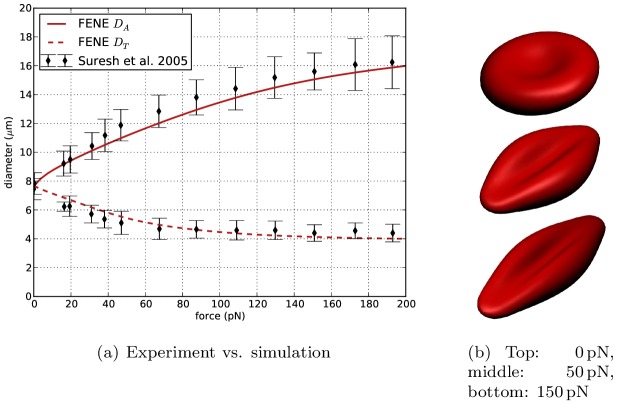
Figure 2. Results of cell stretching.
(a) shows the change of axial diameter  and transversal diameter
  in function of the stretching force, compared to experimental data from Suresh et al. [12]. (b) visualizes red blood cells for different stretching forces.

