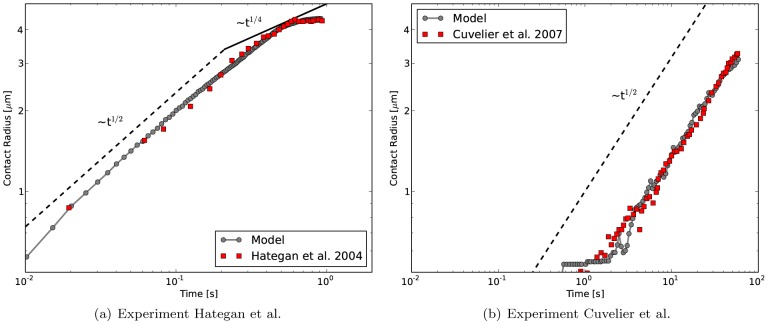
Figure 4. Contact radius vs. time for cell spreading simulations.
comparison with experimental data from (a) Hategan et al. [11] for adhesion strength of  and with data from Cuvelier et al. (b) for adhesion strength of
  – here, we use a coarser mesh with 642 nodes instead of 2562 nodes since the cell does not spread completely in the given time-frame and therefore does not exhibit the high local curvatures as in the Hategan et al. experiment.

