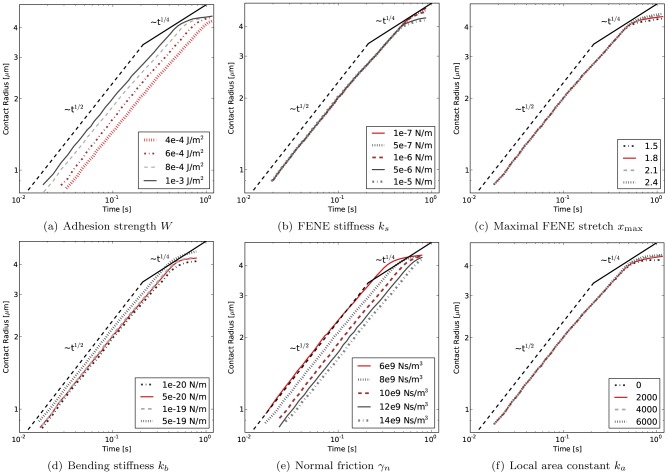
Figure 5. Variation of most influential model parameters.
Double-logarithmic plots of cell contact radius  versus time. (a) varying cell-substrate adhesion strength
  yields both a shift in speed and final contact radius. (b) varying the FENE stretching constant
  yields different final contact radii, (c) varying the FENE max strain
  also mostly influences the final contact radii, (d) varying bending stiffness
  influences both spreading speed and final contact radius, (e) varying the normal friction coefficient
  influences spreading speed and (f) varying the local area constraint constant
  influences the final spreading radius. For a comparison of spreading rates, see supplementary Figure S1.

