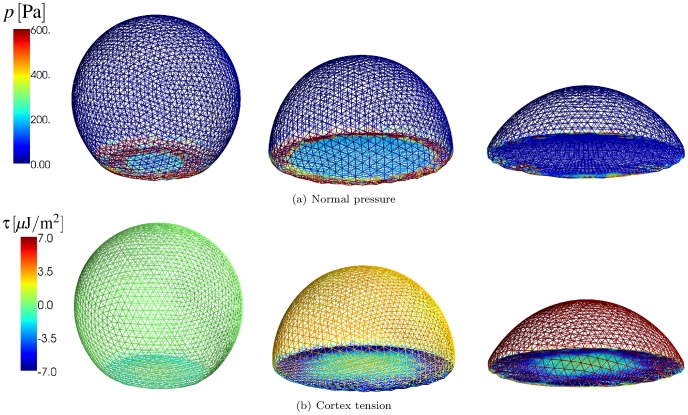
Figure 6. Normal pressure and cortex tension of a spreading RBC.
(a) Normal pressure (the magnitude of the sum of all conservative forces projected onto the normal in that node) at different time points during cell spreading. left:  , middle:
  , right:
  . (b) Cortex tension (see equation 1) averaged at the nodes during cell spreading at the same time points. In the supplementary Video S2 the sum of all conservative forces acting at each node is indicated by small arrows which are mostly visible for the out-of-plane forces. The distribution of stretch in the cortex is visualized in supplementary Figure S2.

