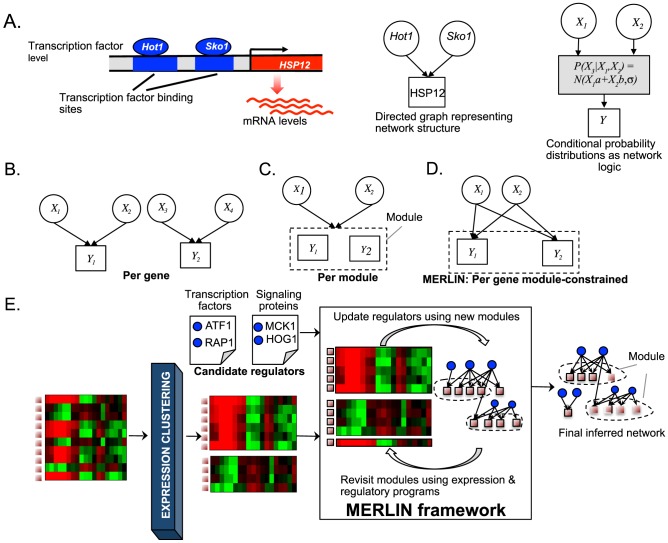
Figure 1. Per-gene and per-module regulatory network inference approaches.
A. Modeling transcriptional regulatory networks as a probabilistic graphical model. Shown is a cartoon of a gene promoter HSP12, with two regulators that bind to its promoter to regulate its level. Regulatory networks are represented using a directed graph specifying who regulates whom, with arrows from regulators to target genes. The network logic of how the regulator levels predicts the target gene expression level is modeled through conditional probability distributions in a probabilistic graphical model. B. Per-gene regulatory network learning. Regulators for each gene are inferred independently. C. Per-module network inference. Regulators are inferred for each module. All genes in the same module have the same parameters. D. Per-gene module constrained network learning used in MERLIN. Gene-specific regulatory programs are inferred while imposing module constraints to enable genes in the same module to share regulators. E. MERLIN learning framework for inferring regulatory module networks. The algorithm starts with an initial set of expression clusters and candidate regulators and iterates between learning regulatory programs for each gene, and revisiting the module membership. The final inferred network is the output of MERLIN comprising the per-gene regulatory programs and the module membership of each gene.

