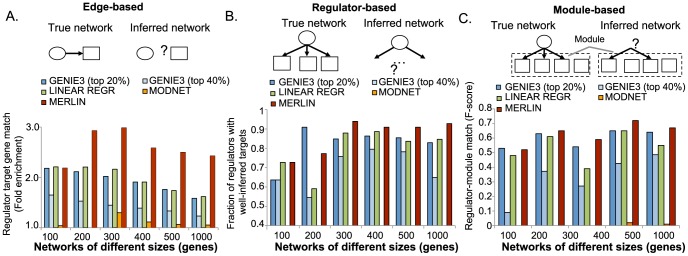
Figure 2. Comparison of MERLIN against per-gene and per-module network inference algorithms using simulated data.

A. Comparison based on fold enrichment of true edges in the inferred network. The cartoon illustrates that this metric compares each edge in isolation. The fold enrichment is positive, and higher it is the better the inferred network in terms of the true edges recovered, and the false edges not inferred. B. Fraction of regulators whose targets in the true network are significantly overlapping with its targets in the inferred network (higher is better). The cartoons shows that this metric compares a set of genes, namely, the targets of a regulator. Each network had different numbers of total regulators, NET100: 11, NET200: 22, NET300: 33, NET400: 44, NET500: 55, NET1000: 111, which we used to obtain a fraction of regulators in each network. C. Overlap as measured by F-score between regulator-module relationships in the true network and regulator-module relationships from the inferred networks. The cartoon shows this metric compares networks based on the regulators associated with known modules. F-score ranges from 0 to 1, and the closer it is to 1 the better the performance.
