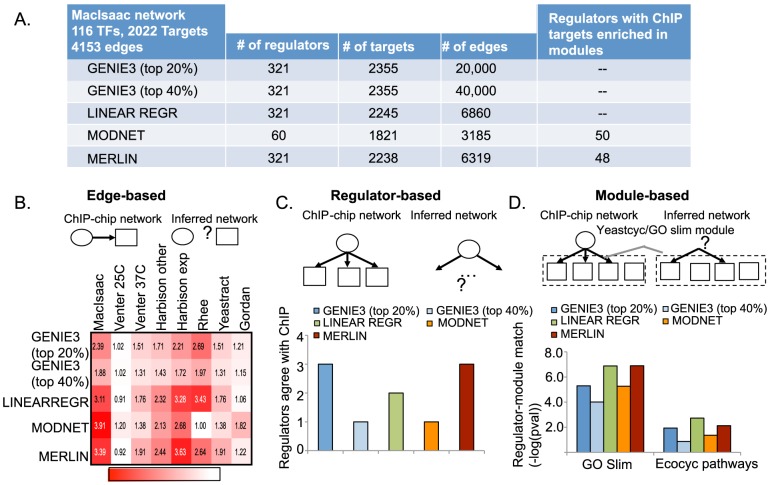
Figure 3. Comparison of MERLIN against per-gene and per-module network inference algorithms using a large compendia of gene expression data in yeast stress response.
A. Shown are the various network statistics of the inferred networks. The last column in the table shows the number of regulators with targets significantly overlapping between ChIP targets and modules. B. Comparison based on fold enrichment of physical regulatory edges measured using various experimental methods such as ChIP-chip, in the inferred networks. The more red, the higher the fold enrichment and the better the inferred network is able to capture these physical interactions. The columns correspond to the different experimentally derived networks: ChIP-chip (Harbison, Venters), ChIP-exo (Rhee), and protein binding microarrays followed by manual curation (Gordan). C. Number of regulators whose targets in the true network are significantly overlapping with its targets in the inferred network. D. Overlap as measured by −log(pval) between regulator-module relationships in the ChIP-chip network from MacIsaac et al. A module here corresponds to either a Yeastcyc pathway or set of genes annotated with a particular GO slim process term.

