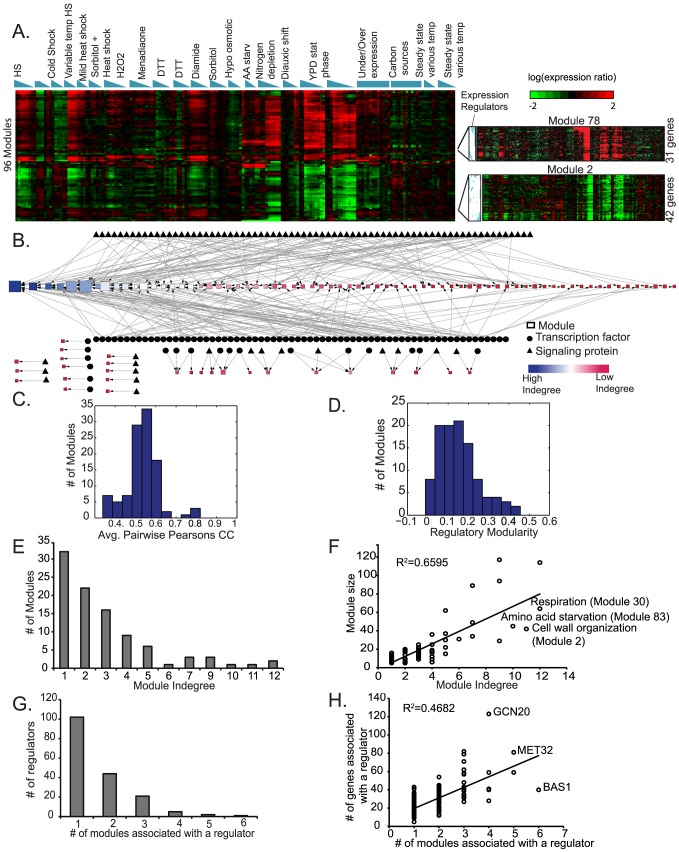
Figure 4. Global organization of yeast stress response network revealed by MERLIN.
A. Major patterns of expression in each module inferred by MERLIN. Each row represents the mean of the expression profile of a module. The rows are ordered based on hierarchical clustering of the means of the modules followed by an optimal leaf ordering of the rows so that rows that are the most similar to each other are closest. B. Shown are the regulators and modules with edges from regulators to target modules (squares). The size of the module is indicated by the number of genes in each module. The color and the ordering of the module nodes is according to the number of regulators associated with each module. C. Histogram of average Pearson's correlation between each pair of genes assigned to a module. Majority of the modules have greater than 0.5 correlation suggesting genes in a module are co-expressed. D. Histogram of regulatory modularity of a module measuring the extent to which genes from the same module share predicted regulators versus between genes from different modules. High regulatory modularity suggests genes in the same module share more regulators than genes that are not in the same module. E. The distribution of the number of regulators per module F. Scatter plot of module size (number of genes assigned to a module) versus the number of regulators associated with a module based on enrichment of its predicted targets in the module. Module indegree and module size are linearly related ( ). Outlier modules with more regulators than expected by a linear fit to the module size are indicated on the plot. G. Distribution of the number of modules associated with a regulator. H. Scatter plot of the number of modules associated with a regulator based on its predicted target set enrichment versus the number of target genes predicted to be regulated by the regulator.

