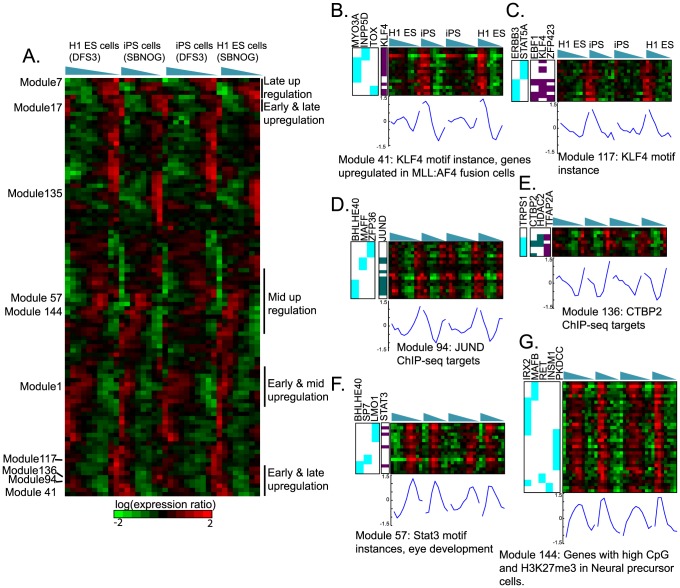
Figure 8. Modules expression patterns inferred by MERLIN on the human ES cell differentiation time course into neural progenitor cells.
A. Each row corresponds to the mean expression profile of one module. The rows are ordered based on hierarchical clustering of the means of the modules followed by an optimal leaf ordering of the rows so that rows that are the most similar to each other are closest. This ordering enables us to see a gradual change in the different temporal dynamics captured in the MERLIN modules. B–G. Selected modules associated with complex temporal patterns. Cyan represents targets (rows) of regulators (columns) predicted by MERLIN, Teal represents ChIP-seq targets, and Purple represents presence of motif instance of a transcription factor ±2 kb around the Transcription Start Site (TSS) of a gene. B–E Modules associated with upregulation at the beginning and end of the time course whose members are also associated with oncogenes such as KLF4, MYC, JUND, and CTB2. F–G Modules associated with initial and late downregulation. G. Shown are the genes of module 144 which is enriched for genes exhibiting high CpG density in promoters in Neural Progenitor cells as annotated in MSigDB [43].

