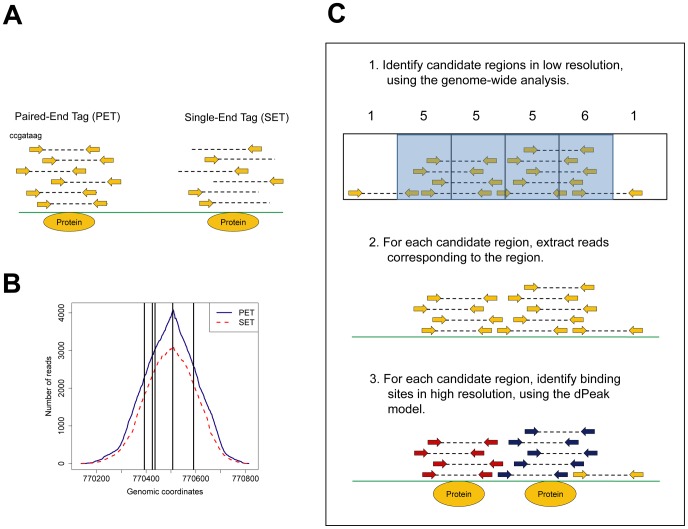
Figure 1. SET and PET ChIP-Seq data structure and the dPeak algorithm.
(A) Description of paired-end tag (PET) and single-end tag (SET) ChIP-Seq data. Directions of arrows indicate strands of reads. (B) Promoter region of the cydA gene contains five closely spaced  binding sites. Blue solid and red dotted curves indicate the number of extended reads mapping to each genomic coordinate in
  PET and SET ChIP-Seq data, respectively. Black vertical lines mark
  binding sites annotated in the RegulonDB database. (C) Pictorial depiction of the dPeak algorithm.

