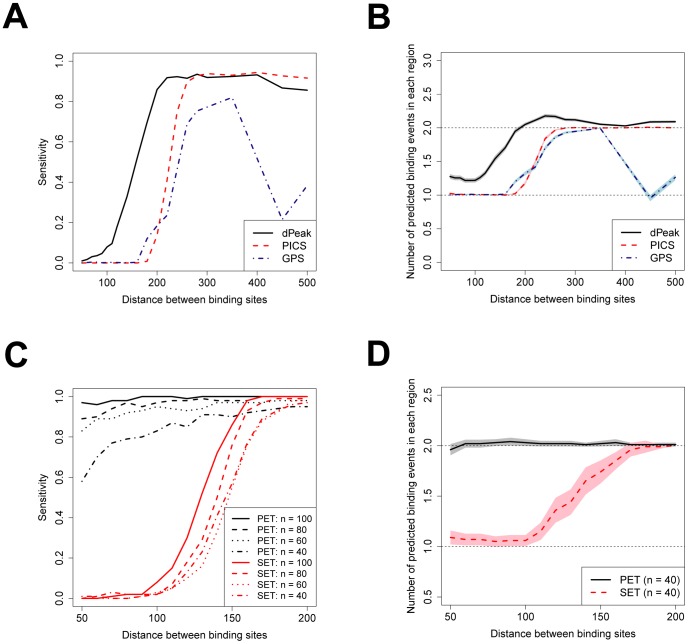
Figure 2. Sensitivity and positive predictive value comparisons of high resolution binding site identification algorithms and dPeak performance on PET vs. SET data.
(A, B) Comparison of dPeak with PICS and GPS in computational experiments designed for the GPS algorithm. (A) dPeak has higher sensitivity than both PICS and GPS for SET ChIP-Seq data, especially when the distance between binding events is less than the library size. (B) When there are two true binding events in each region, dPeak on average generates more than one prediction and results in a comparable positive predictive value to those of PICS and GPS. PICS and GPS on average generate only one prediction when the distance between binding events is less than the library size. Shaded areas around each line indicate confidence intervals. (C, D) Comparison of PET and SET assays with dPeak. (C) For SET ChIP-Seq data, the sensitivity of dPeak significantly decreases as the distance between the locations of the events decreases. In contrast, sensitivity from PET ChIP-Seq data is robust to the distance between closely located binding events. The sensitivity for both PET and SET data also decreases as number of reads decreases. (D) dPeak on average predicts two binding events with PET ChIP-Seq data at any distance between the two joint binding events and results in excellent positive predictive value. SET ChIP-Seq data predicts significantly fewer number of binding events as the distance between binding sites decreases. In (C) and (D), n indicates number of reads corresponding to each binding event and  DNA fragments are used for PET data to match the number of reads between PET and SET data. (D) shows the case that
  reads correspond to each binding event and results are similar for other number of reads. Shaded areas around each line indicate confidence intervals.

