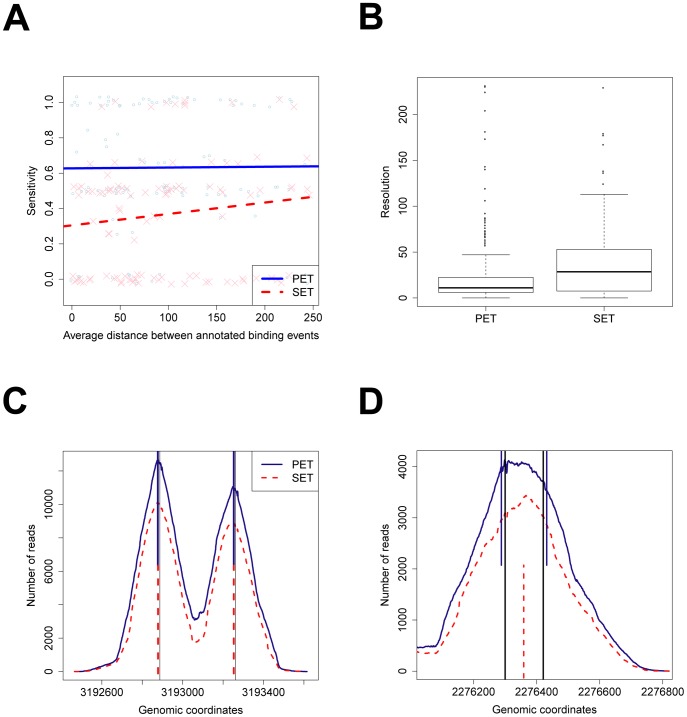
Figure 4. dPeak analyses and evaluations of  PET and SET ChIP-Seq data based on RegulonDB annotated
  factor binding sites.
(A) The numbers of correctly identified binding sites are plotted as a function of the distances between the RegulonDB reported binding events. Linear lines (solid for PET, dashed for SET) through the data points depict general trends. (B) Resolution comparisons of the predictions for the regions with a single annotated binding event. (C, D) PET (blue) and SET (red) coverage plots for representative examples of predicted  binding sites. Blue and red dotted vertical lines indicate predictions using PET and SET data, respectively. Black solid vertical lines indicate the annotated binding sites in (C) and experimentally validated binding sites in (D).

