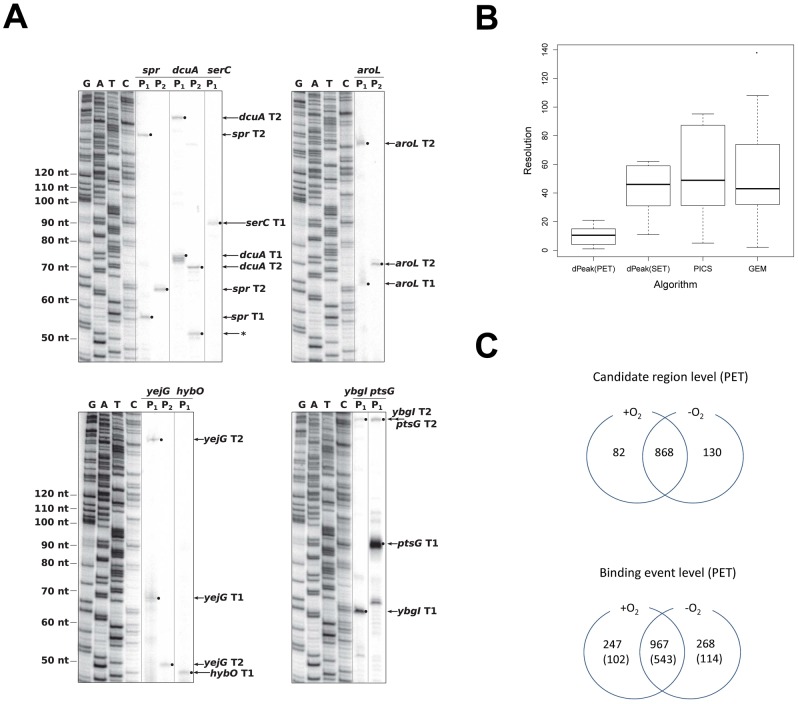
Figure 5. Experimental validation and analysis of differential occupancy using dPeak.
(A) Validation of a subset of transcription start site predictions using primer extension. Primers (Table S7 in Text S1) complementary to the mRNA sequence  downstream of each predicted start site were
  end labeled
  and
and  was used for each
  assay. RNA was isolated from either aerobic (
 ) or anaerobic (
 ) conditions. The sequencing ladders (G, A, T and C) were generated by dideoxy sequencing. Small arrows and filled circles depict the primer extension products. In addition to dcuA
 , a second, less abundant primer extension product (*) was identified with dcuA
 . Since this product was not identified with dcuA
 , it is possible that it corresponds to the start site of an sRNA which terminates upstream of the priming location of
  . (B) Resolution comparison of the high resolution binding site identification algorithms, using experimentally validated sites as a gold standard (extended version in Figure S9C in Text S1). (C) Summary of the analyses of
  and
and  PET ChIP-Seq data. The
  ,
,  , and
, and  candidate regions (the first diagram) cover
  ,
,  , and
, and  of the E. coli genome, respectively. In the bottom diagram, the numbers in parentheses depict the set of binding events that were independently validated with predictions from the analysis of biological replicate SET ChIP-Seq.

