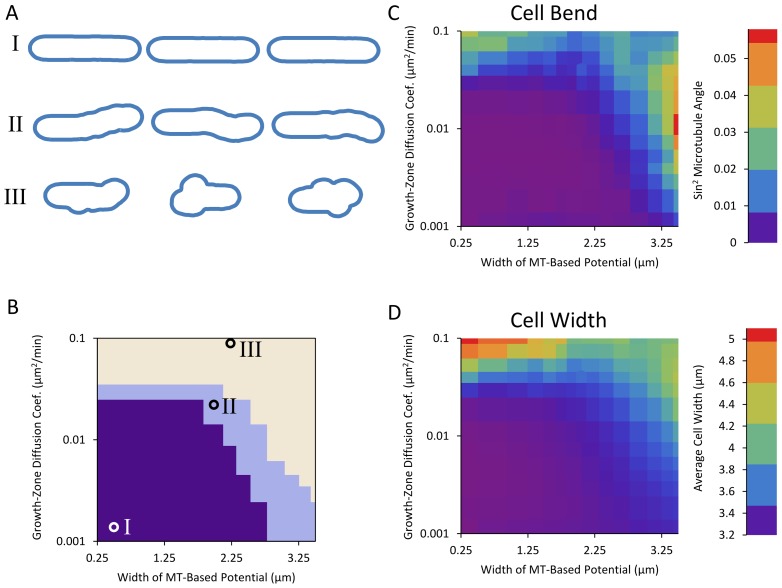
Figure 7. Two-dimensional model with one growing tip generates three families of shapes.
A. Examples of simulated cell outlines (as described in section ‘Model for Shape Maintenance by Growth Zones, Microtubules, and Landmarks’). Three regions in parameter space show occurrence of: (I) straight cells, (II) bent cells, and (III) wide cells. Cell shapes were generated by starting from an outline of a 8 µm long cell with tips shaped according to the model of Fig. 6 and a growth zone placed at one tip. The model was evolved until cell length doubled or thrice the amount of time necessary for a straight-growing cell to double had elapsed. B. Regions of different shapes as function of growth zone diffusion coefficient D gz and standard deviation of microtubule-based potential σMT. Circles on plot indicate parameters used for the shapes in panel A. For the definition of the regions, see Methods. The depth of the potential was U 0 = 0.2 µm2/min, a value that shows a range of model behaviors. If the potential is very deep, any diffusion coefficient that allows the growth zone to escape from the tip also allows it to explore the side of the cell. If the potential is very shallow, a diffusion coefficient that allows the growth zone to be confined also precludes exploration of most of the cell boundary during the growth phase of the cell. C. Cell bend, measured as squared sine of angle between initial and final cell axes as described in Methods as a function of the same parameters as in panel B. D. Cell width, measured as described in Methods, as a function of same parameters as in panel B.

