
Figure 5. Projected proportional contribution of total disease burden by broad cause groups in 2025 (The most probable scenario).
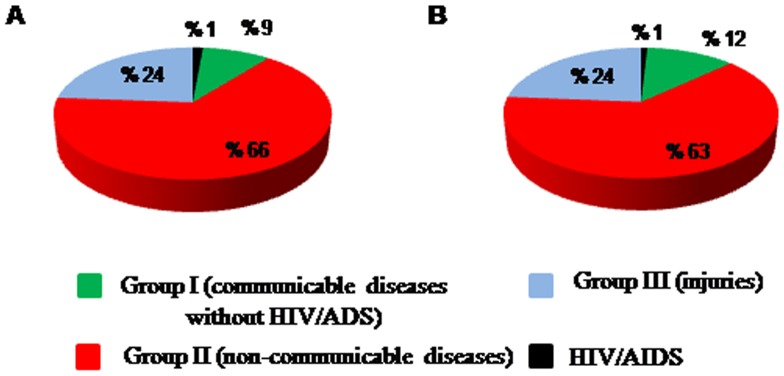
Panel A shows the values in total population and panel B per 100,000 population.
Official websites use .gov
A
.gov website belongs to an official
government organization in the United States.
Secure .gov websites use HTTPS
A lock (
) or https:// means you've safely
connected to the .gov website. Share sensitive
information only on official, secure websites.
Panel A shows the values in total population and panel B per 100,000 population.