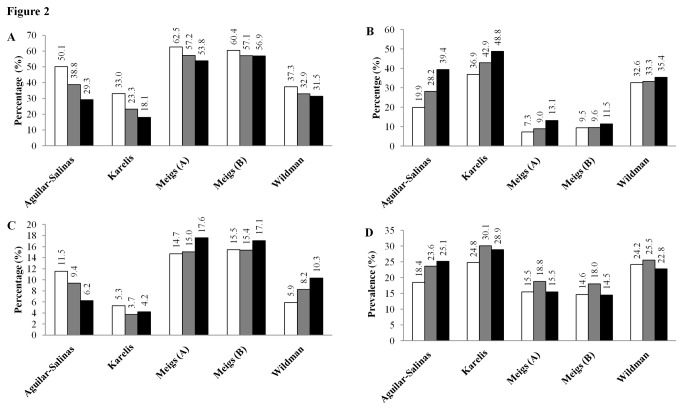
Figure 2. Prevalence of metabolically healthy and unhealthy obese and non-obese phenotypes according to different criteria stratified by age group.
The prevalence of metabolically healthy non-obese subjects (A) decreased with age according to each definition. Conversely estimates of metabolically unhealthy non-obese subjects (B) increased with age according to each definition. Metabolically healthy obesity (C) prevalence differed according to which definition was used. The Aguilar-Salinas et al., and Karelis et al., definitions identified the highest prevalence among the 45-54 yr olds whereas the Wildman et al., and Meigs et al., definitions found the greatest prevalence of MHO among the 65-74 yr olds. Prevalence of metabolically unhealthy obesity (D) was consistently highest among the 55-64 yr olds, with the exception of the Aguilar-Salinas et al., definition. Meigs A is defined using metabolic syndrome variables and Meigs B is defined using HOMA. Results are expressed as percentage of all subjects within each age category. The 45-54, 55-64 and 65-74 yr old age groups are depicted as white, grey and black bars, respectively.

