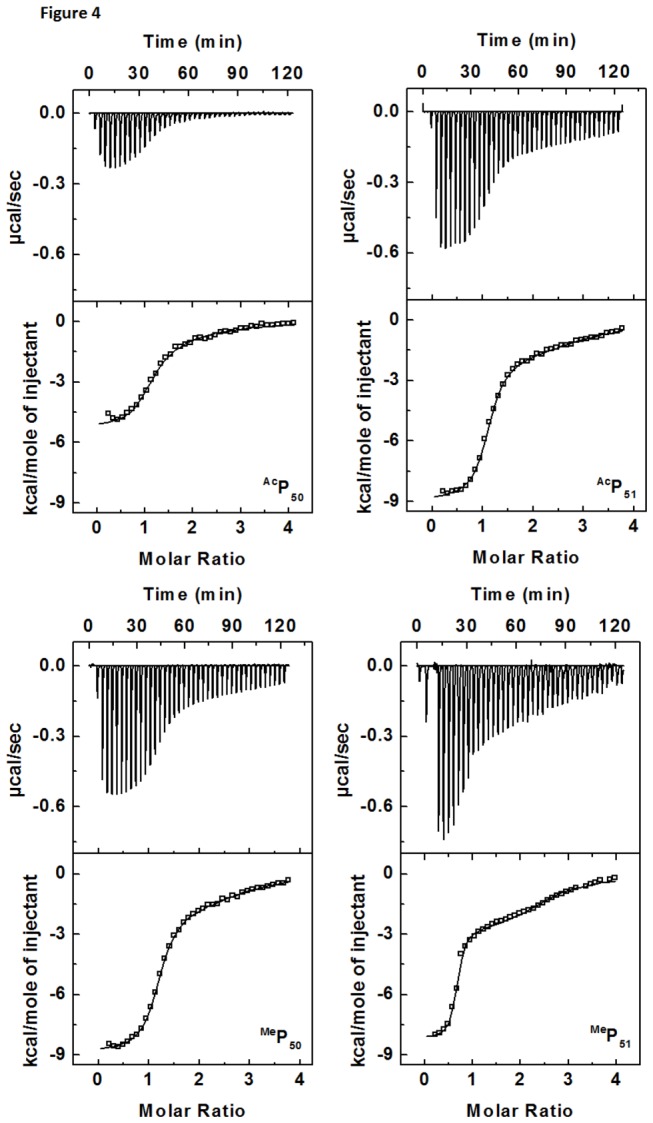
Figure 4. ITC titration profile of TAR RNA with Tat and different modified peptides at 25 °C.

Upper panel shows the baseline corrected experimental data for peptide binding, lower panel shows the molar heats of binding (□) plotted against the peptide to RNA molar ratio. Buffer condition was as described in the caption to Figure 2. Molar heat of binding is calculated by integration of the area under the curve of each heat burst using the origin version 7.0 software (Microcal, Inc.; Northampton, MA). Fitting of ITC data (shown as solid line) was done using model for two set of binding [38] given in origin version 7.0 software (Microcal, Inc.; Northampton, MA).
