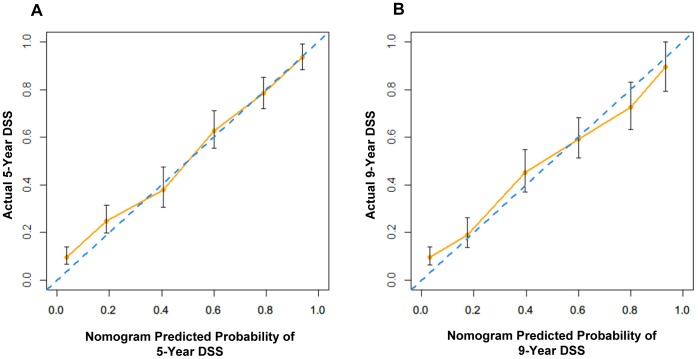
Figure 2. Calibration plots for the MSKCC nomogram in Chinese cohort.
On the calibration plot, x-axis is the nomogram-predicted probability of DSS, and y-axis is the actual probability of DSS estimated by the Kaplan-Meier method. The dotted line represents the ideal nomogram; the solid line represents the performance of the MSKCC nomogram in Chinese cohort. (A) Five-year nomogram, (B) Nine-year nomogram.

