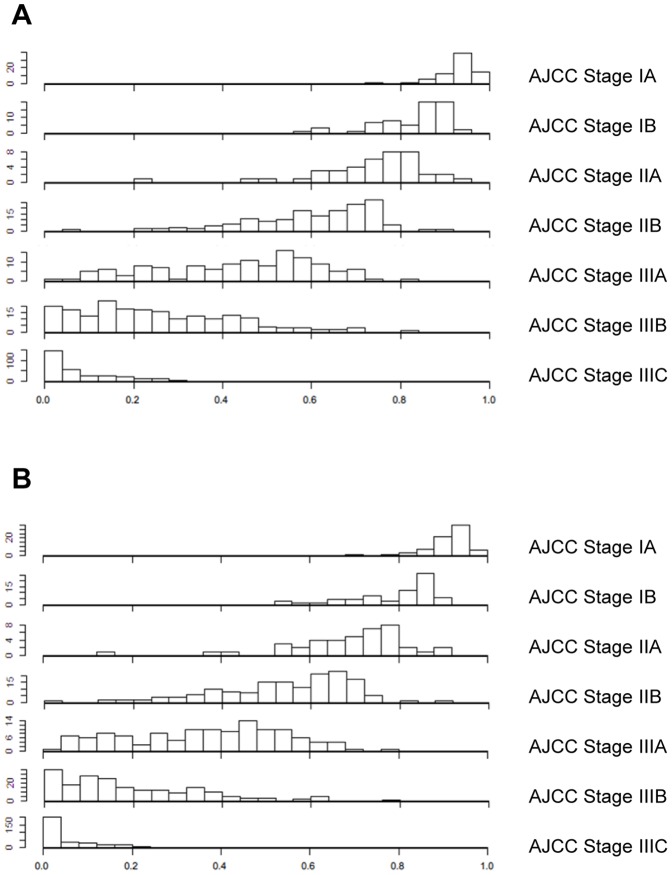
Figure 3. Histogram of the MSKCC nomogram-predicted probabilities within each AJCC stage.
The x-axis represents AJCC stages, and the y-axis represents nomogram-calculated probability of DSS. Note the heterogeneity of predicted probabilities of survival within each AJCC stage, especially in stages IIA, IIB, IIIA, and IIIB. (A) Five-year predictons, (B) Nine-year predictions.

