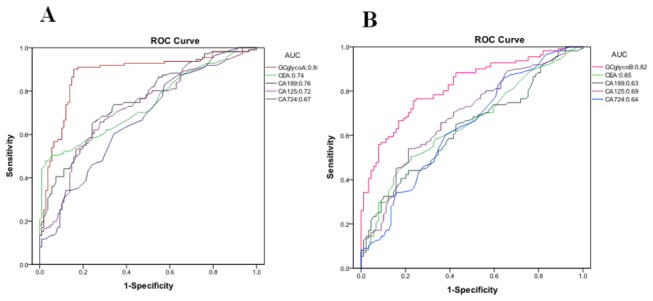
Figure 3. Receiver operating characteristic (ROC) curve analyses for the prediction of gastric carcinoma (GC).

(A) The ROC analysis for distinguishing between GC and control subjects using an N-glycan marker-based GC diagnostic model (GCglycoA), CEA, CA19-9, CA125 or CA72-4. The areas under the ROC curve (AUCs) indicate the diagnostic power: CEA (0.74), CA19-9 (0.76), CA125 (0.72), CA72-4 (0.67) and GCglycoA (0.88). The diagnostic model was constructed by using forward stepwise logistic regression analysis:
GCglycoA = -1.072+0.957peak4-0.331peak6+0.646peak9. (B) The ROC analysis for distinguishing between GC and atrophic gastritis using the GCglycoB diagnostic model, CEA, CA19-9, CA125 or CA72-4. The AUCs indicate the diagnostic power: GCglycoB (0.82), CEA(0.65), CA19-9 (0.63), CA125 (0.69) and CA72-4 (0.64). The diagnostic model was constructed by using forward stepwise logistic regression analysis: GCglycoB=5.273-1.371peak2+0.781peak4-0.453peak6+0.221peak9.
