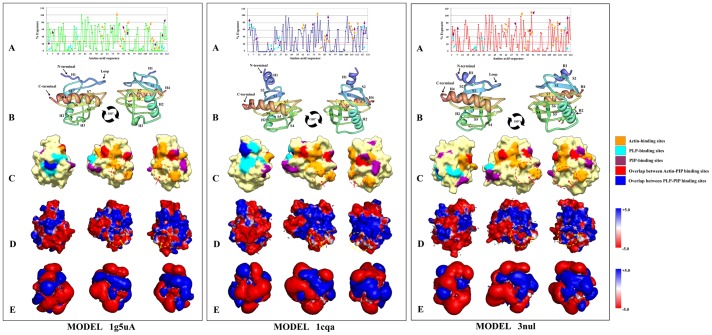
Figure 1. Surface distribution analysis of the profilin polymorphism.
Different colors were used to highlight the different degree of variability over the surface for the three models used in this study, A) 1cqa, B) 1g5uA, and C) 3nul models. Residues which variability were high (variability index value, viv>3) were depicted in yellow color. Residues with intermediate (1<viv>3) and low (viv<1) variability were depicted as green and blue, respectively [102]–[104]. Surface residues implicated in ligand-binding domains (actin, PLP and/or PIP) were highlighted with transparent white shadows over the protein surface and discontinues borders lines. Red dotted circles and red arrows pointed a detailed plant specific solvent-filled cavity.

