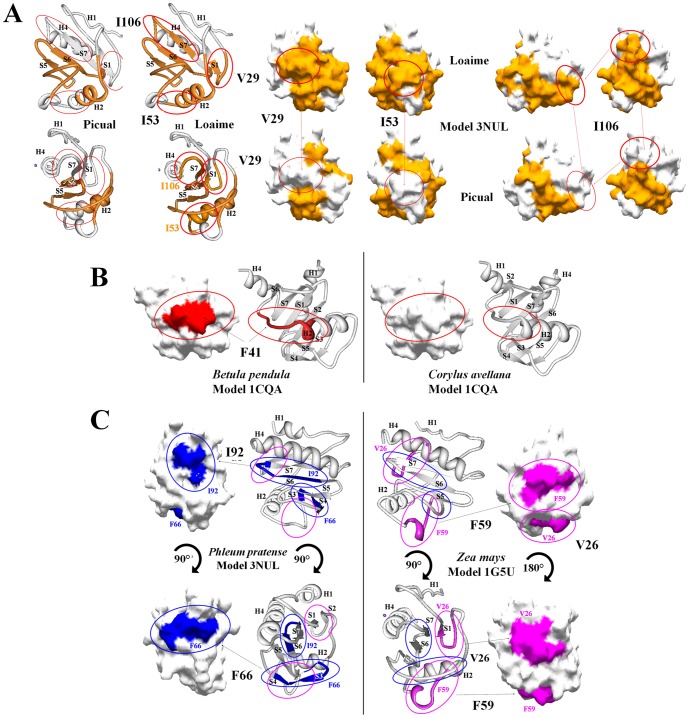
Figure 6. Olive cultivars and species specific distribution of T-cell epitopes.
A) Cartoon representation of profilin model 3nul two views rotated 45° respectively two examples of olive cultivars, ‘Picual’ and ‘Loaime’, to compare the localization in the 2-D structural elements of the protein of the common shared T-cell epitopes between both cultivars, and the specific epitopes (V29, I53 and I106) only present in Loaime cultivar. All epitopes were depicted in orange color. Surface superimposition of both, common and not shared epitopes, are depicted in the same color over the model 3nul of profilin. Red circles were used to highlight the specific epitopes. B) Cartoon representation of profilin model 1cqa of the same view for both species of the Betulaceae genus, Betula pendula and Corylus avellana, showing the specific T-cell epitope F41, only present in Betula pendula. Presence or absence of the F41 epitope was located and highlighted in the 2-D structural elements of the protein, as well as over the surface of the model by using red color and red circles. C) Specific epitopes location and comparison between two species of the genus Poaceae, Phleum pratense and Zea mays, by using cartoon representation of 2-D profilin elements or protein surface over the models 3nul and 1g5uA two views rotated 90° or 180°, respectively. Blue color over the model surface and blue circles were used to highlight Phleum pratense specific T-cell epitopes F66 and I92. Pink circles were used to highlight the absence of Zea mays specific T-cell epitopes V26 and F59 over the 3nul model. Reciprocity of colors was used to show the presence or absence of specific epitopes in the model 1g5uA for Zea mays.

