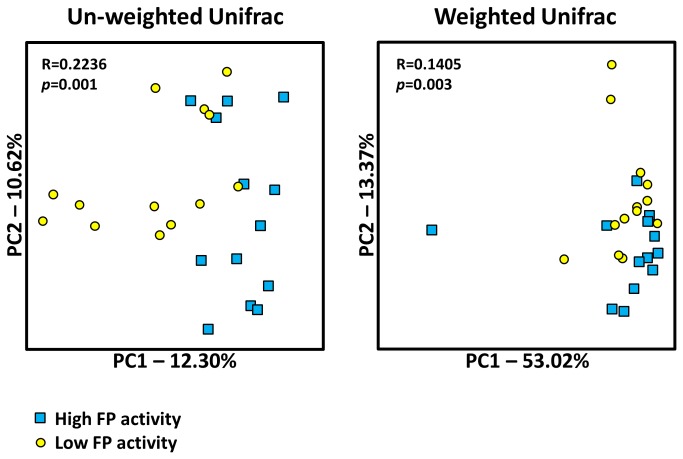
Figure 3. Bacterial community composition analysis between samples with high (n=13) and low (n=13) FP activity.
Principal coordinates analysis (PCoA) plots of un-weighted and weighted UniFrac distances for samples with high (blue circles) and low (yellow squares) FP activity are shown. Analysis of similarity (ANOSIM) demonstrated a significant separation in the composition of fecal microbiotas between high and low FP activity samples using both un-weighted (p=0.001) and weighted (p=0.003) UniFrac distances. The R statistic (where R=1 and R=0 signifies differences and no differences between groups, respectively) is higher in the un-weighted analysis suggesting the separation between microbiotas is a result of both high and low abundances bacterial species.

