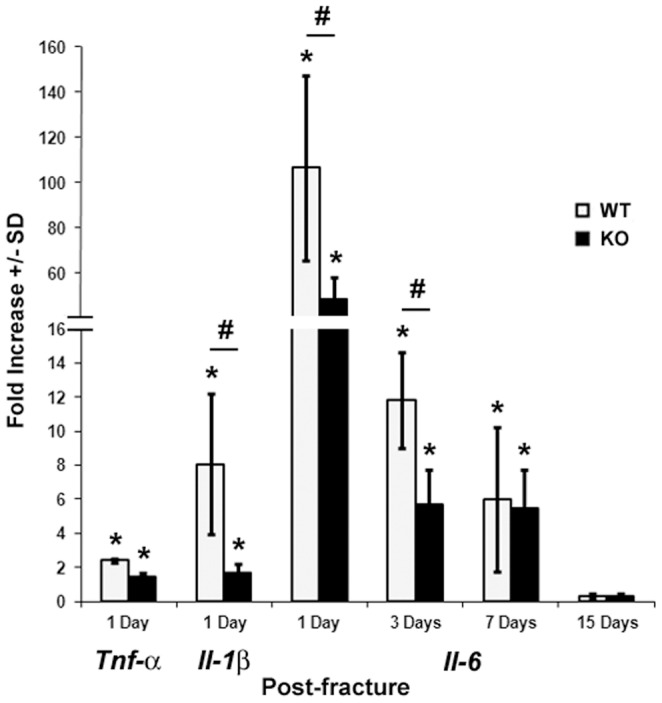
Figure 6. Expression of cytokine genes at four time points post-fracture.

Data are expressed as fold-change in the expression of the gene in the fractured bones compared to unfractured bones of WT mice. We analyzed 3–4 animals/mouse strain at 1 and 3 days and 5–8 mice at 7 and 15 days post-fracture.*p<0.05 vs WT unfractured bones, #p<0.05 between fractured bones of the two lines of mice.
