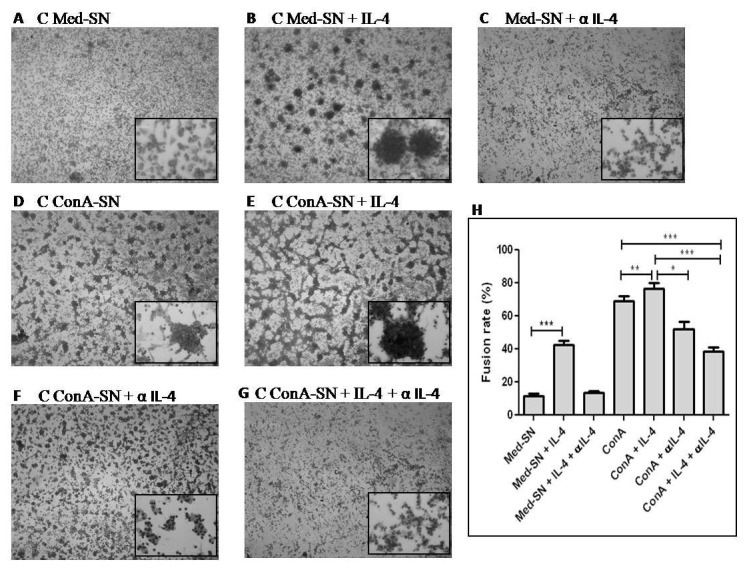
Figure 5. Effect of IL-4 and anti-IL-4 antibody (α IL-4) on in vitro MGC formation.

Figure shows representative Leishman stained pictures of MGC formation and fusion rate of monocytes obtained from healthy controls (n=5) incubated with autologous culture supernatants. (A) unstimulated culture supernatant (Med-SN) (B) Med-SN + IL-4 (C) Med-SN + IL-4 + αIL-4 (D) ConA stimulated culture supernatant (ConA-SN) (E) ConA-SN + IL-4 (F) ConA-SN + α IL-4 (G) ConA-SN + IL-4 + α IL-4 (H) Graph showing effect of IL-4 and anti-IL-4 on percent fusion rate of in vitro MGC formation. Comparability of groups was analyzed by Mann–Whitney U-test. A Bonferroni–Holm procedure was used to correct for multiple comparisons between groups. *p < 0.05, **p < 0.01, ***p < 0.001, ****p<0.0001.
